Fig. 7
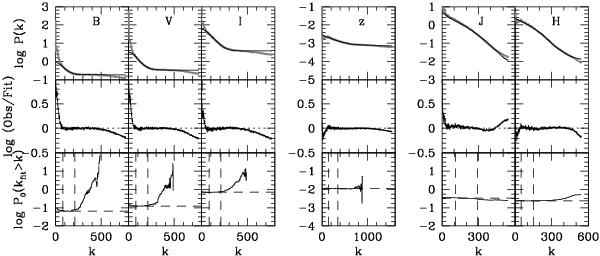
Power spectrum analysis of the BVIzF850LPJF110WHF160W frames. Each panel shows a different band, as labeled. For all bands, the upper panels show the logarithm of the power spectrum of the residual frame (gray dots) and the best fit P(k) curve. In the middle panels the difference between observed and fitted power spectra is shown. The flat region of log P0(kfit > k) between vertical dashed lines (lower panels) is used to evaluate the best fit parameters P0, and P1.
Current usage metrics show cumulative count of Article Views (full-text article views including HTML views, PDF and ePub downloads, according to the available data) and Abstracts Views on Vision4Press platform.
Data correspond to usage on the plateform after 2015. The current usage metrics is available 48-96 hours after online publication and is updated daily on week days.
Initial download of the metrics may take a while.