Fig. 5
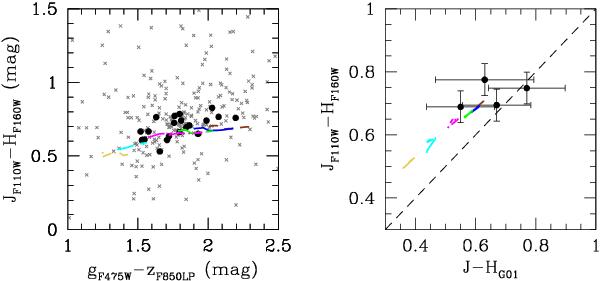
Left panel: colour–colour diagram with the ACS and WFC3/IR magnitudes. Gray crosses mark the full sample of common sources, black circles show selected GC candidates (see text). Right panel: comparison between WFC3/IR photometry and the IRAC2 data from Goudfrooij et al. (2001a). In both panels the predictions from SPoT simple stellar population models with different metallicity are shown with different colour/line styles ([Fe/H] = −2.3, −1.4, −0.7, −0.4, 0.0 and +0.4 dex shown with dark-yellow, cyan, magenta, green, blue and brown, respectively). The age range is 3 to 14 Gyr. (See electronic version of the Journal for a colour version of the figure.)
Current usage metrics show cumulative count of Article Views (full-text article views including HTML views, PDF and ePub downloads, according to the available data) and Abstracts Views on Vision4Press platform.
Data correspond to usage on the plateform after 2015. The current usage metrics is available 48-96 hours after online publication and is updated daily on week days.
Initial download of the metrics may take a while.