Free Access
Fig. 4
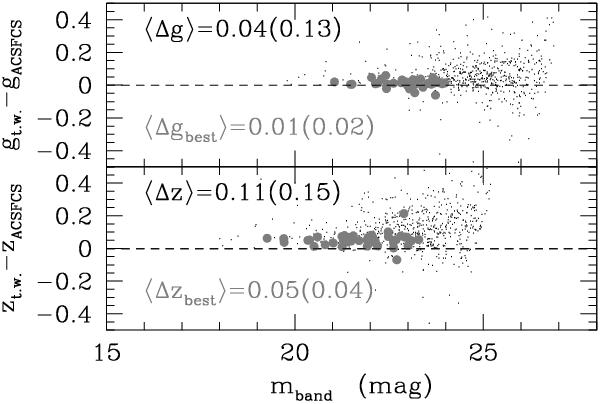
Comparison between our photometry and the ACSFCS results. Black dots and labels refer to the whole sample of ~620 matched sources, gray circles and labels to the ~40 selected sources. The median difference and the associated rms are also reported.
Current usage metrics show cumulative count of Article Views (full-text article views including HTML views, PDF and ePub downloads, according to the available data) and Abstracts Views on Vision4Press platform.
Data correspond to usage on the plateform after 2015. The current usage metrics is available 48-96 hours after online publication and is updated daily on week days.
Initial download of the metrics may take a while.