Fig. 7
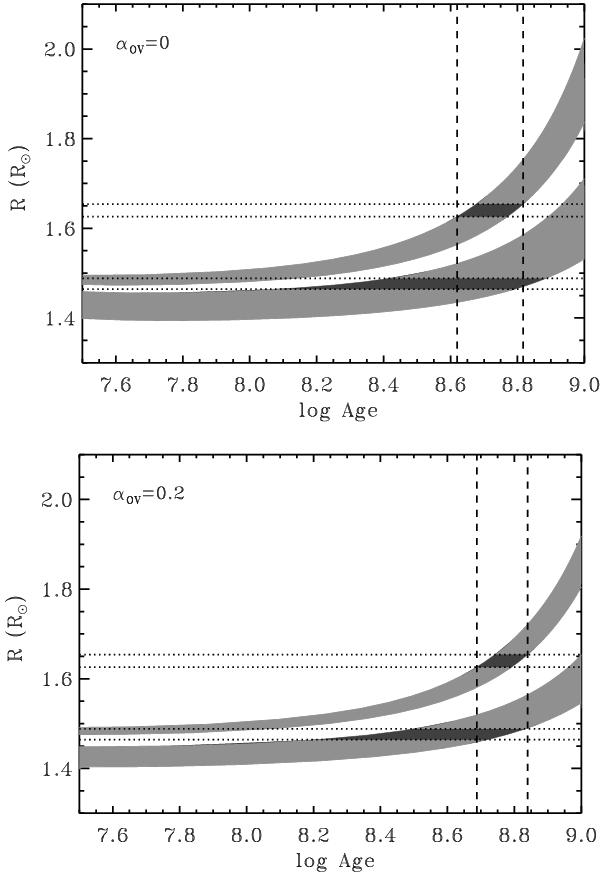
Evolution of the component radii. Upper panel: based on models without overshooting, αOV = 0; lower panel: αOV = 0.2. The light gray bands describe the time evolution of the radii for stars in the mass range M1,2 ± ΔM1,2, from Table 3. The darker areas fill the intersection with the R1,2 ± ΔR1,2 lines from the same table. The vertical lines bound the time interval respecting the constraint of coevality.
Current usage metrics show cumulative count of Article Views (full-text article views including HTML views, PDF and ePub downloads, according to the available data) and Abstracts Views on Vision4Press platform.
Data correspond to usage on the plateform after 2015. The current usage metrics is available 48-96 hours after online publication and is updated daily on week days.
Initial download of the metrics may take a while.