Free Access
Fig. 6
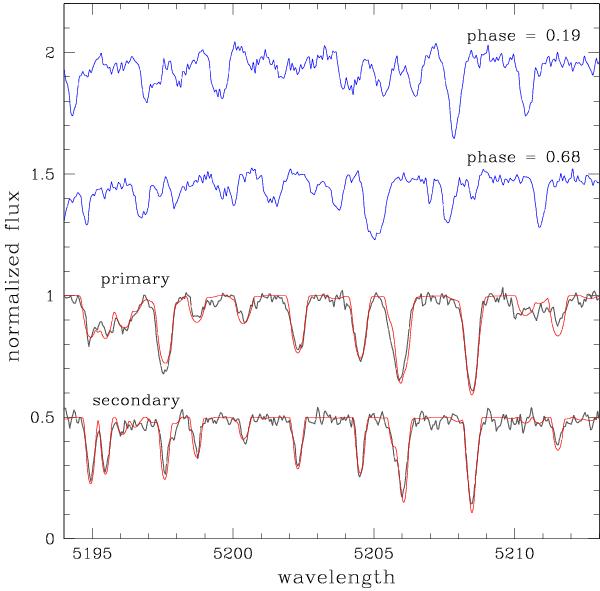
Short spectral stretch of two observed composite spectra at different orbital phases from the FEROS dataset. The two individual disentangled spectra are shown at the bottom along the best-fitting synthetic spectra calculated for the effective temperatures and surface gravities derived in Sects. 4 and 5 (Tables 3 and 4).
Current usage metrics show cumulative count of Article Views (full-text article views including HTML views, PDF and ePub downloads, according to the available data) and Abstracts Views on Vision4Press platform.
Data correspond to usage on the plateform after 2015. The current usage metrics is available 48-96 hours after online publication and is updated daily on week days.
Initial download of the metrics may take a while.