Fig. 8
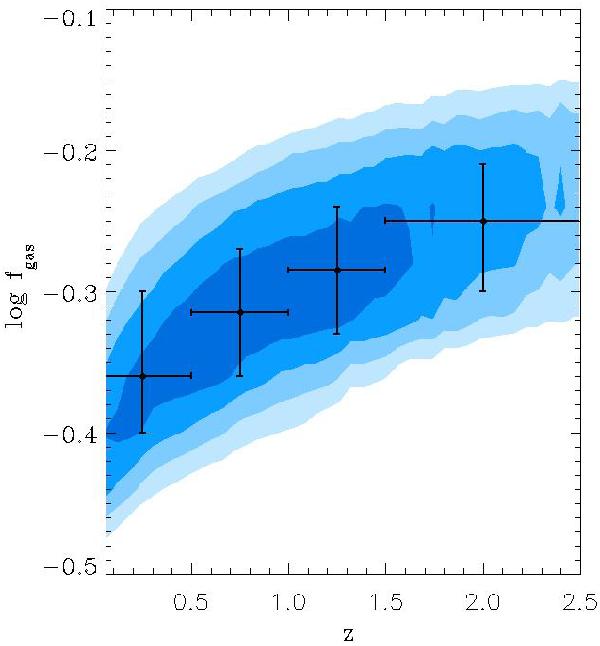
Gas fraction distributions as a function of the redshift of model galaxies with
SSFR > tH(z)-1
and
M∗ > 1010 M⊙.
The filled contours correspond to equally spaced values of the density (per
Mpc3) of galaxies on a logarithmic scale: from 10-3 for the
lightest filled region to 10-2.1 for the darkest. The plotted value of
log fgas is the median value for sources in four
redshift bins:  (0 < z < 0.5);
 (0.5 < z < 1);
 (1 < z < 1.5);
 (1.5 < z < 2.5).
The vertical error bars show the interpercentile range containing 68% of the
sources.
(1.5 < z < 2.5).
The vertical error bars show the interpercentile range containing 68% of the
sources.
Current usage metrics show cumulative count of Article Views (full-text article views including HTML views, PDF and ePub downloads, according to the available data) and Abstracts Views on Vision4Press platform.
Data correspond to usage on the plateform after 2015. The current usage metrics is available 48-96 hours after online publication and is updated daily on week days.
Initial download of the metrics may take a while.