Fig. 7
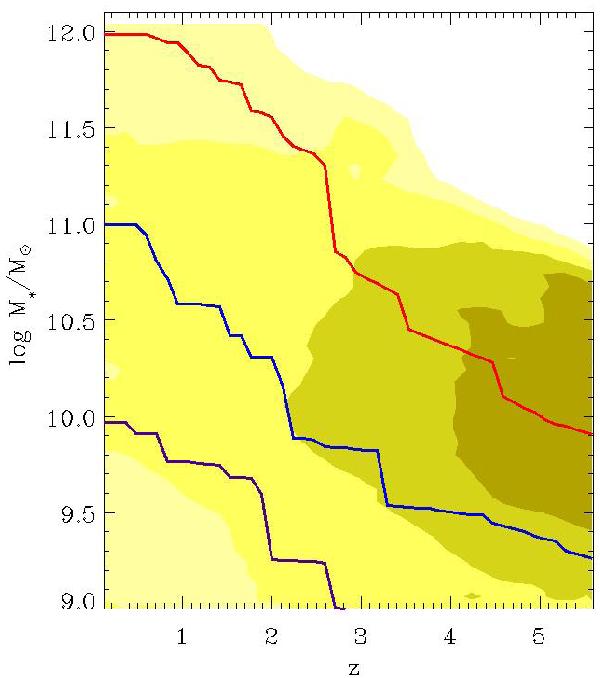
Predicted average values of the ratio Mburst(z)/M∗(z) as a function of redshift and galaxy stellar mass. The four filled contours correspond to equally spaced values of the ratio Mburst(z)/M∗(z): from 0.05 for the lightest filled region to 0.2 for the darkest. The lines illustrate the growth histories of a typical galaxy with final mass: M∗(z = 0) = 1012 M⊙ (red), M∗(z = 0) = 1011 M⊙ (blue), and M∗(z = 0) = 1010 M⊙ (purple).
Current usage metrics show cumulative count of Article Views (full-text article views including HTML views, PDF and ePub downloads, according to the available data) and Abstracts Views on Vision4Press platform.
Data correspond to usage on the plateform after 2015. The current usage metrics is available 48-96 hours after online publication and is updated daily on week days.
Initial download of the metrics may take a while.