Fig. 4
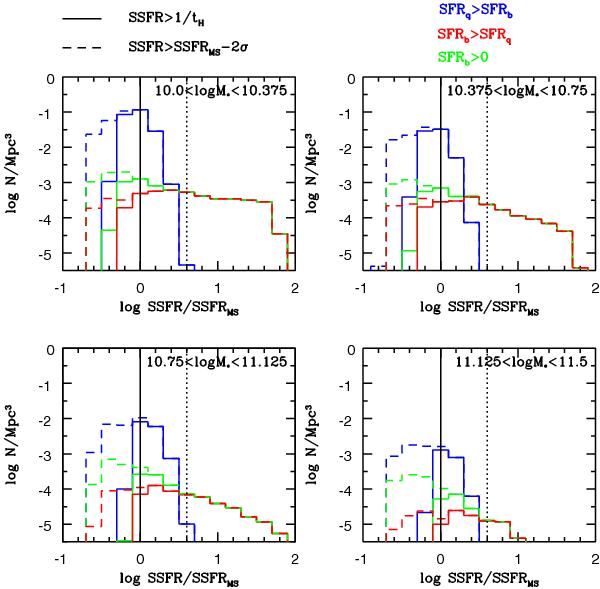
SSFR distributions of model galaxies, at 1.5 < z < 2.5, in four mass bins. The blue histograms refer to galaxies dominated by the quiescent mode of star formation, the red histograms to galaxies dominated by the burst mode of star formation, and the green histograms to galaxies with an interaction-driven star formation component. The solid vertical lines show the position of the main sequence, while the vertical dotted lines show the SSFR threshold used to identify starburst galaxies: SSFRSB > 4 × SSFRMS. The solid distributions are obtained by selecting galaxies with SSFR > tH(z)-1, while dashed distributions are obtained selecting galaxies with SSFR > SSFRMS − 0.6 dex.
Current usage metrics show cumulative count of Article Views (full-text article views including HTML views, PDF and ePub downloads, according to the available data) and Abstracts Views on Vision4Press platform.
Data correspond to usage on the plateform after 2015. The current usage metrics is available 48-96 hours after online publication and is updated daily on week days.
Initial download of the metrics may take a while.