Fig. 2
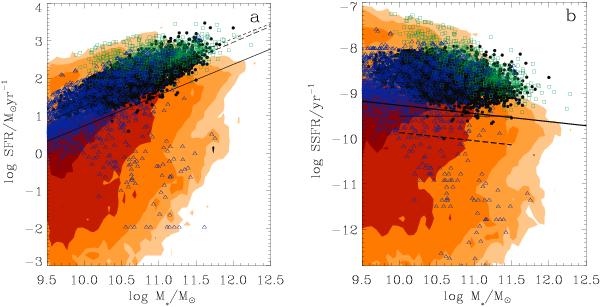
Left: SFR-M∗ relation at 1.5 < z < 2.5. The five filled contours correspond to equally spaced values of the density (per Mpc3) of model galaxies in logarithmic scale: from 10-6 for the lightest filled region to 10-2 for the darkest. Green squares: Herschel-PACS- selected galaxies, black circles: BzK galaxies, from the Rodighiero et al. (2011) sample; blue triangles: GOODS-MUSIC catalogue from the Santini et al. (2009) sample. The dashed and long-dashed lines indicate the best-fit of the galaxy main sequence obtained by Rodighiero et al. (2011) and Santini et al. (2009) respectively, while the solid line shows the spline fit to the peaks of the SFR distributions of model galaxies as a function of stellar mass. Right: SSFR as a function of M∗. Colour code, symbols, and solid line as in the left panel. The dashed and thin solid lines respectively indicate the SSFR > SSFRMS − 2σ and the SSFR > tH(z)-1 limits of the galaxy samples used in the analysis of Sect. 3.2.
Current usage metrics show cumulative count of Article Views (full-text article views including HTML views, PDF and ePub downloads, according to the available data) and Abstracts Views on Vision4Press platform.
Data correspond to usage on the plateform after 2015. The current usage metrics is available 48-96 hours after online publication and is updated daily on week days.
Initial download of the metrics may take a while.