Fig. 1
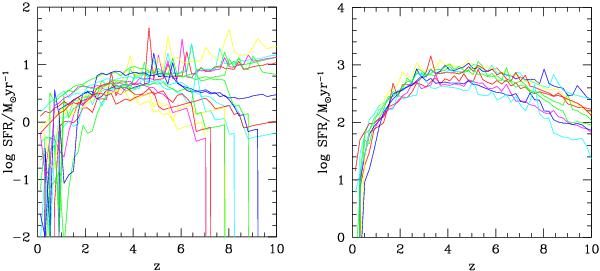
SFHs drawn from the Monte Carlo realizations of galaxies, which, at z = 0, have masses of M∗ ≃ 1010 M⊙ (left) and M∗ ≃ 1012 M⊙ (right). The SFHs are obtained by summing over all the progenitors that have merged to form galaxies of the selected final mass. The quiescent star formation is represented by the smooth component of the SFHs, the burst component by the impulsive one. The duration of the SFR-excess phase due to the interactions is represented by the width of the peak of the SFHs.
Current usage metrics show cumulative count of Article Views (full-text article views including HTML views, PDF and ePub downloads, according to the available data) and Abstracts Views on Vision4Press platform.
Data correspond to usage on the plateform after 2015. The current usage metrics is available 48-96 hours after online publication and is updated daily on week days.
Initial download of the metrics may take a while.