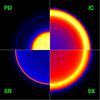
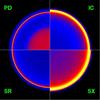
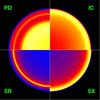
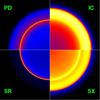
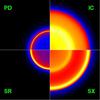
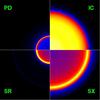
Fig. 7
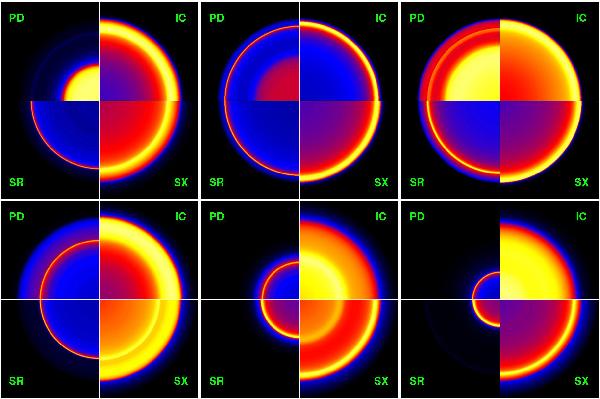
Time evolution of intensity maps of type-Ic (top) and type-IIP (bottom) SNRs at 1 TeV due to pion-decay (PD) and inverse Compton (IC), at 3 keV (SX) and at 1.4 GHz (SR) due to synchrotron radiation. The left column is for the age of 400 years, the middle column at 1000 years, and the right column at 1975 years. The scale is linear from zero to maximum in each image. All images are normalized by the FS radius, RFS, at the respective time.
Current usage metrics show cumulative count of Article Views (full-text article views including HTML views, PDF and ePub downloads, according to the available data) and Abstracts Views on Vision4Press platform.
Data correspond to usage on the plateform after 2015. The current usage metrics is available 48-96 hours after online publication and is updated daily on week days.
Initial download of the metrics may take a while.