Fig. 7
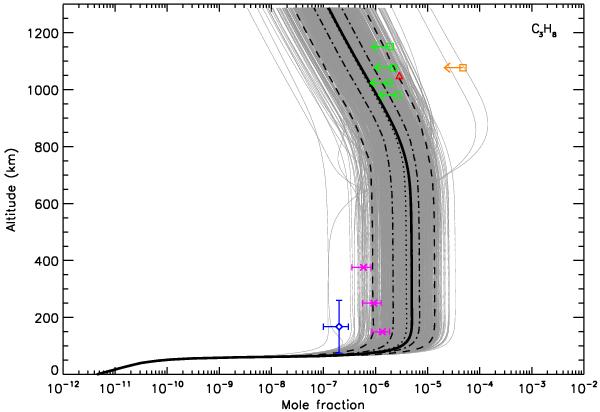
Abundance profiles of propane C3H8 obtained after 900 runs. Black solid line: initial profile. Black dotted line: median profile obtained from the uncertainty propagation study. Black dashed-dotted lines: 5th and 15th 20-quantiles of the distribution. Black long-dashed lines: 1st and 19th 20-quantiles of the distribution. The blue open diamond refers to ISO observations from Coustenis et al. (2003), the red open triangle to Cassini/INMS observations from Magee et al. (2009), the green crossed squares to Cassini/INMS observations from Cui et al. (2009), the orange square to the corrected Cassini/INMS observations from Cui et al. (2009), the pink crosses to Cassini/CIRS observations at 3.5˚N from Vinatier et al. (2010).
Current usage metrics show cumulative count of Article Views (full-text article views including HTML views, PDF and ePub downloads, according to the available data) and Abstracts Views on Vision4Press platform.
Data correspond to usage on the plateform after 2015. The current usage metrics is available 48-96 hours after online publication and is updated daily on week days.
Initial download of the metrics may take a while.