Free Access
Fig. A.1
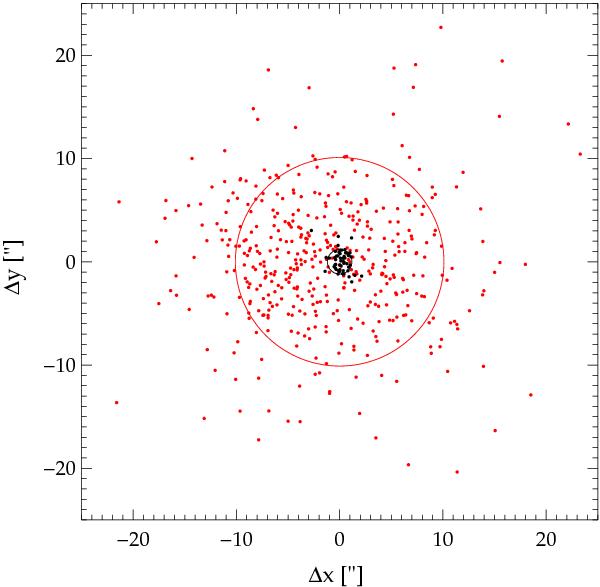
Offsets along R.A. and Dec. between the original coordinates and those of Table A.1 (red points). The red circle (Δr = 10″) contains 68% of the sample considered here. Black dots and circle (Δr = 1.2″) show the offsets between the Lisker’s coordinates (priv. comm.) and our values.
Current usage metrics show cumulative count of Article Views (full-text article views including HTML views, PDF and ePub downloads, according to the available data) and Abstracts Views on Vision4Press platform.
Data correspond to usage on the plateform after 2015. The current usage metrics is available 48-96 hours after online publication and is updated daily on week days.
Initial download of the metrics may take a while.