Fig. B.1
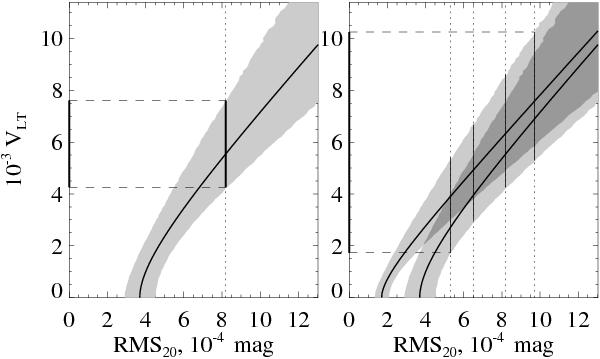
Left panel: the dependency of the VLT parameter on the solar variability, retrieved from the stellar data. The shaded area indicates the uncertainty (2σ) due to the limited number of stars. The V11 parameter is set to 0.00044 mag. The dashed line corresponds to the expected mean solar variability rms20 = 0.00082. The projection onto VLT-axis yields the 95% interval for expected long-term variability of the Sun: 0.43% < VLT < 0.76%. Right panel: the same as the left panel, but the contour calculated with V11 = 0.0002 mag is added. The four dashed lines correspond to four values of expected mean solar variability rms20: 0.00097 mag (no chromospheric secular changes, regression with solid line from Fig. 1), 0.00082 mag (strong chromospheric secular changes, regression with solid line), 0.00065 mag (no chromospheric secular changes, regression with dashed line), 0.00053 mag (strong chromospheric secular changes, regression with dashed line). The projection onto the VLT-axis yields the interval 0.17% < VLT < 1.2%.
Current usage metrics show cumulative count of Article Views (full-text article views including HTML views, PDF and ePub downloads, according to the available data) and Abstracts Views on Vision4Press platform.
Data correspond to usage on the plateform after 2015. The current usage metrics is available 48-96 hours after online publication and is updated daily on week days.
Initial download of the metrics may take a while.