Free Access
Fig. 3
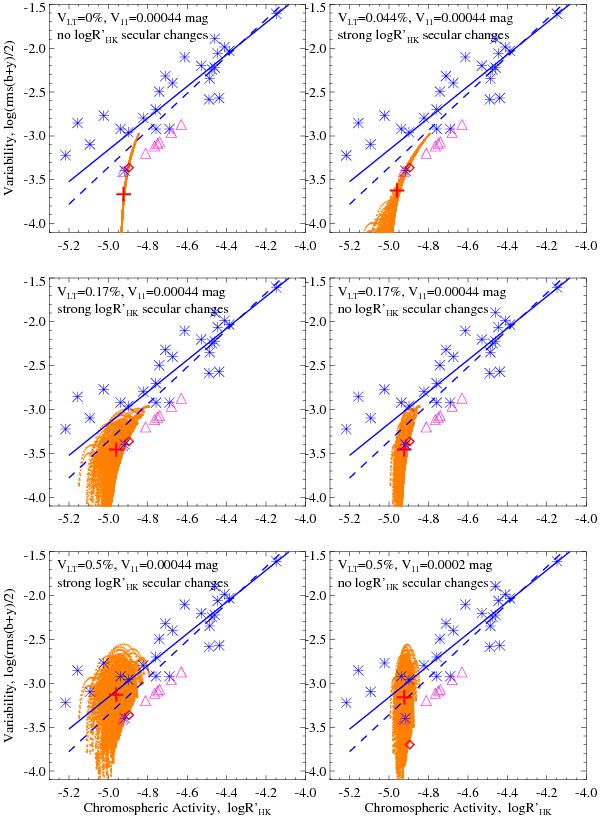
The same as Fig. 1, but with trajectories of the Sun over the last 9000 years (orange dots) for different sets of the long-term variability VLT and the 11-year variability V11. The red square and cross symbols indicate the positions of the present and “mean” Sun.
Current usage metrics show cumulative count of Article Views (full-text article views including HTML views, PDF and ePub downloads, according to the available data) and Abstracts Views on Vision4Press platform.
Data correspond to usage on the plateform after 2015. The current usage metrics is available 48-96 hours after online publication and is updated daily on week days.
Initial download of the metrics may take a while.