Fig. 2
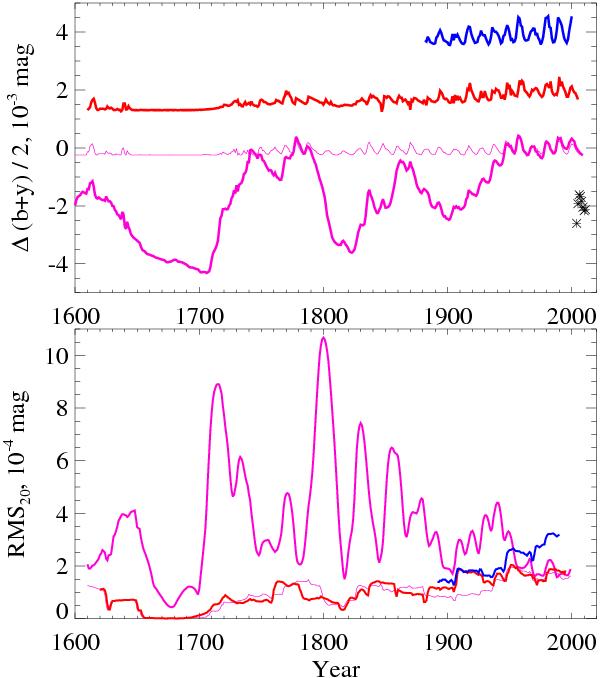
Upper panel: annual (b + y)/2 values versus time according to the spectral solar irradiance (SSI) reconstructions to the past as calculated by Krivova et al. (2010) (red), Lean et al. (2005) (blue) and Shapiro et al. (2011) (magenta: thick and thin curves are original data and data with removed secular changes, respectively). Stars indicates the SIM/SORCE measurements. Lower panel: calculated for the 20 year time intervals rms20 values versus time.
Current usage metrics show cumulative count of Article Views (full-text article views including HTML views, PDF and ePub downloads, according to the available data) and Abstracts Views on Vision4Press platform.
Data correspond to usage on the plateform after 2015. The current usage metrics is available 48-96 hours after online publication and is updated daily on week days.
Initial download of the metrics may take a while.