Fig. 1
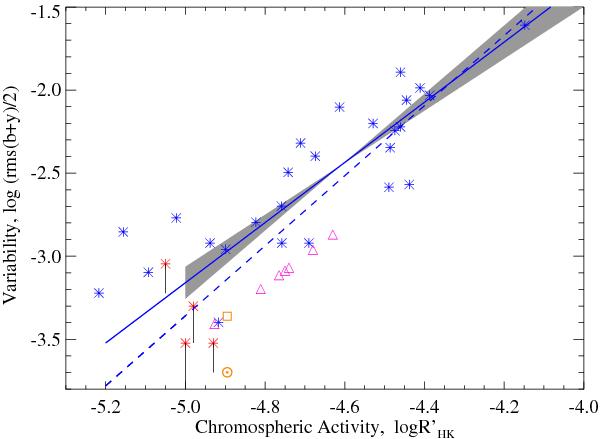
Photometric variability versus chromospheric activity. The blue stars indicate the stars with observed variability from Lockwood et al. (2007). Magenta triangles indicate lower limits for stars with unconfirmed variability set at about 0.5 below the regression line. The solid (5.892+1.810  ) and dashed (7.180+2.108 ) lines are regressions calculated excluding and including stars with unconfirmed variability, respectively. The shaded area corresponds to the one-sigma error. The four red stars indicate HD 10307, HD 95128, HD 168009, and HD 146233 (18 Sco) from Hall et al. (2009). Drop lines indicate the correction for the variability of the comparison stars. The orange symbols denote the position of the Sun according to modern reconstructions (solar symbol) and the Lockwood et al. (2007) estimate (square symbol).
Current usage metrics show cumulative count of Article Views (full-text article views including HTML views, PDF and ePub downloads, according to the available data) and Abstracts Views on Vision4Press platform.
Data correspond to usage on the plateform after 2015. The current usage metrics is available 48-96 hours after online publication and is updated daily on week days.
Initial download of the metrics may take a while.