| Issue |
A&A
Volume 552, April 2013
|
|
|---|---|---|
| Article Number | A18 | |
| Number of page(s) | 7 | |
| Section | Stellar structure and evolution | |
| DOI | https://doi.org/10.1051/0004-6361/201220440 | |
| Published online | 15 March 2013 | |
The nearby eclipsing stellar system δ Velorum
IV. Differential astrometry with VLT/NACO at the 100 microarcsecond level⋆
1 LESIA, Observatoire de Paris, CNRS UMR 8109, UPMC, Université Paris Diderot, 5 place Jules Janssen, 92195 Meudon, France
e-mail: This email address is being protected from spambots. You need JavaScript enabled to view it.
2 European Southern Observatory, Alonso de Córdova 3107, Casilla 19001, Santiago 19, Chile
3 European Southern Observatory, Karl-Schwarzschild-Str. 2, 85748 Garching, Germany
4 Astronomical Institute, Slovak Academy of Sciences, 059 60 Tatranská Lomnica, Slovakia
5 Université de Nice-Sophia Antipolis, Lab. Lagrange, UMR 7293, Observatoire de la Côte d’Azur, BP 4229, 06304 Nice, France
Received: 25 September 2012
Accepted: 7 February 2013
Abstract
Context. The stellar system δ Vel contains the brightest eclipsing binary in the southern sky (δ Vel A), and a nearby third star located ≈ 0.6″ away (δ Vel B). The proximity of δ Vel B (usable as a reference) makes it a particularly well-suited target to detect the astrometric displacement of the center of light of the eclipsing pair.
Aims. We obtained NACO astrometric observations with two goals: 1) to confirm the orientation of the orbital plane of the eclipsing pair on the sky determined by interferometry (Paper III); and 2) to demonstrate the capabilities of narrow-angle adaptive optics astrometry on a simple system with predictable astrometric properties.
Methods. We measured the angular separation vector between the eclipsing binary δ Vel A and the visual companion δ Vel B from narrow-band images at 2.17 μm obtained with the VLT/NACO adaptive optics system. Based on these observations and our previous determination of the orbital parameters of the wide binary δ Vel A-B, we derived the apparent displacement of the center of light of the eclipsing pair at 11 epochs over its orbital cycle.
Results. We detect the astrometric wobble of the center of light of the δ Vel A pair relative to B with a typical measurement precision of ≈ 50 μas per epoch, for a total amplitude of the measured displacement of ≈2 mas.
Conclusions. The detected wobble is in relatively good agreement with the model we presented in Paper III, and confirms the orientation of the Aab orbital plane on the sky. The residual dispersion compared to our model is 110 μas rms, which we tentatively attribute to photometric variability of the fast rotating A-type components Aa and/or Ab in the Brγ line. Based on these results, we conclude that in favorable conditions (bright source with only two resolved components, small angular separation), narrow-angle astrometry with adaptive optics on an 8-meter class telescope can reach an accuracy of 50 to 100 μas.
Key words: stars: individual:δVelorum / binaries: eclipsing / methods: observational / techniques: high angular resolution / astrometry
Based on observations made with ESO telescopes at the La Silla Paranal Observatory, under ESO programs 081.D-0109(A), 081.D-0109(B), 382.D-0065(A), and 282.D-5006(A).
© ESO, 2013
1. Introduction
The bright southern star δ Vel (HD 74956, HIP 41913, GJ 321.3, GJ 9278) is a multiple system comprising at least three stars. Its brightest component, δ Vel A, was identified only in 2000 as one of the brightest eclipsing systems in the sky (Otero et al. 2000). We consider here the two main components of the δ Vel system (Aa+Ab and B) as a test case to validate the potential of high-precision narrow-angle astrometry from the ground using adaptive optics. Exciting results were recently obtained using this observing technique, e.g., by Clarkson et al. (2012), Hußmann et al. (2012), and Kölher et al. (2012). These authors typically measured differential astrometry within a field of view of a few arcseconds to an accuracy of a few 100 μas (see e.g., Table 4 in Clarkson et al. 2012). We propose here to push this observing technique to its precision limits on δ Vel, which appears to be a particularly favorable target (bright and geometrically simple), in order to evaluate its potential.
In previous works on the δ Vel system, Kervella et al. (2009, Paper I) searched for infrared circumstellar excess in the inner δ Vel A-B system whose present angular separation is approximately 0.6″. Part of the NACO data presented here was also used in this first article, although not for high-precision astrometry. Pribulla et al. (2011, Paper II) and Mérand et al. (2011, Paper III) obtained the orbital elements and fundamental parameters (including the parallax of the system) of the three components of the δ Vel system. In the present study, we take advantage of the well-constrained and accurate model of the system obtained in these previous works to predict the astrometric wobble of the center of light (hereafter CL) of the eclipsing system, and compare it with the measured NACO astrometry. We detail our observations and data analysis procedure in Sect. 2, and describe the method we used to derive the wobble of the CL of the eclipsing component in Sect. 3. We discuss in Sect. 4 the differences between the astrometric wobble predicted by the model and the observed displacement.
2. Observations and data reduction
2.1. Observing log and raw data processing
We observed δ Vel at 11 epochs in April–May 2008 and January 2009 using the Nasmyth Adaptive Optics System (NAOS, Rousset et al. 2003) of the Very Large Telescope (VLT), coupled to the CONICA infrared camera (Lenzen et al. 1998), which is abbreviated as NACO. These observations were obtained primarily to provide high-precision differential astrometry of the eclipsing system δ Vel A relative to B, following the promising demonstration by Seifahrt et al. (2008). We selected the smallest available pixel scale of 13 mas/pixel, giving a field of view of 13.6″× 13.6″. Because of the brightness of δ Vel, we employed a narrow-band filter1 at a wavelength of 2.166 ± 0.023 μm (hereafter abbreviated as 2.17 μm) together with a neutral density filter (labeled “ND2_short”, that has a transmission of about 1.5%). The 2.17 μm filter wavelength corresponds to the Brackett γ line of hydrogen. A detailed list of the NACO exposures obtained in 2008 is presented in Table 2 of Paper I. At each epoch 50 exposures were obtained, always centering component A on the same pixel of the CONICA detector array to mitigate the possible effects of field distorsion.
Differential astrometry of δ Vel derived from the NACO images.
The raw images were processed in a standard way: dark subtraction, flat fielding, and cosmetics removal. We considered three approaches for the flat-field and dark-frame calibration: using specific dark and flat-field frames obtained separately for each night, using average flat/dark frames, and using median flat/dark frames (the last two computed over our 2008 observation epochs). For these different methods, the star positions extracted from the resulting data cubes are identical within 4 × 10-3 pixels, or 50 μas. This figure is comparable to our statistical measurement uncertainties, and we conclude that we do not detect a significant astrometric variability induced by the flat field or dark. We therefore chose to use the median flat and dark frames over all observations. This remarkable stability is probably because NACO was kept cold and was not dismounted from the telescope over the period of our 2008 observations. Along this line, Neuhäuser et al. (2008) demonstrated that the plate scale of NACO is extremely stable (to <5 × 10⁻⁴, in relative terms) over three years. The cosmetic corrections we applied concerned only pixels located outside of our astrometric windows (Sect. 2.2), as the areas used for each star position were specifically chosen to present no dead or hot pixels. They therefore had no influence on the astrometric measurements.
2.2. Star separation measurement
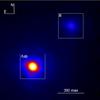 |
Fig. 1 Average image of δ Vel obtained on 2008 Apr. 01, together with the 21 × 21 pix astrometric windows that we used for the differential astrometry (white squares). |
To measure the separation of the two star images on the NACO detector, we treated each image in our data cubes separately. We extracted two sub-images of 21 × 21 pixels centered on the positions of A and B (as shown in Fig. 1). We then used a classical χ2 minimization algorithm to shift and scale the sub-image of δ Vel A over the position of the fainter component B. Our choice of relatively small sub-windows prevents the contamination by the background noise that may present inhomogeneous patterns. We checked that the fit is not sensitive to the chosen size of the sub-windows over a large range of values. To achieve this fit, we computed a sub-pixel interpolation of the shifted image of A, using the Yorick2 language, and more specifically using an interpolation routine in the Fourier space3. We derived four parameters: the relative shifts dx and dy in pixels between the two star images, the flux ratio ρ = fA/fB, and the uniform background level C. In order to estimate their associated error bars, we used the bootstrapping technique described in Appendix B of Kervella et al. (2004). We validated the Fourier interpolation method by comparing its results with a simple Gaussian fit of the two PSF cores that give the same relative positions (within 150 μas) although with larger dispersion due to the mismatch of the slightly seeing-distorted PSF and the Gaussian function. Thanks to their angular proximity, δ Vel A and B share the same residual optical aberrations from the adaptive optics system. Because it takes advantage of the similarity of their images, our fitting approach based on Fourier interpolation is particularly efficient.
For the conversion of the star separations measured in pixels to angular values, we adopted the pixel scale of 13.26 ± 0.03 mas/pixel (Masciadri et al. 2003). This value is in good agreement with the pixel scale obtained by Neuhäuser et al. (2008, 13.24 ± 0.06. Our differential astrometric measurements are affected only by the ±0.23% pixel scale uncertainty over the amplitude of the astrometric wobble of the CL of Aa–Ab and not over the full angular separation of A and B. As shown in Sect. 3, the astrometric wobble amplitude is less than 2 mas, and the corresponding ≈ 4 μas systematic error is therefore negligible compared to our statistical accuracy.
2.3. Differential atmospheric refraction
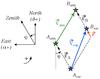 |
Fig. 2 Geometrical effect of the atmospheric refraction on the differential astrometry of a binary star (see Sect. 2.3 for details). |
The angular separation of δ Vel A and B is only ≈ 0.6″ for the epoch of our observations. Although this angle is quite small, the effect of differential atmospheric refraction is not negligible considering that the precision of our measurements (≈ 50 μas per epoch in right ascension and declination) corresponds to only ≈ 1/12 000th of the separation of the two stars. Figure 2 shows schematically the effect of atmospheric refraction on the apparent positions of the two stars. In this diagram the sky positions of the two stars in the absence of atmosphere are labeled with the “vac” subscript, while the apparent positions measured from the ground are labeled “atm”; ϕ is the parallactic angle (positive after local celestial meridian crossing) at the time of the observation; Vatm and Vvac are the vector separations of A and B with and without atmosphere, respectively; ϵA and ϵB are the apparent vector displacements of the position of the stars due to atmospheric refraction; and r is the resulting differential astrometry correction vector.
The quantity of interest for our purpose is the vector separation of the two stars Vvac(Δαvac,Δδvac). From a simple vectorial closure, the transformation to apply to the measured differential astrometry vector on the sky Vatm(Δαvac,Δδatm) is  (1)where r = ϵA − ϵB. We computed the values of | ϵA | and | ϵB | using the slaRefro routine from the Starlink library4 and the apparent positions of the two stars. The r = (Δαr,Δδr) vector is always pointing towards zenith. This routine realizes an integration of the effect of the atmospheric crossing on the apparent direction of the incoming star light using a realistic atmospheric model (Liebe et al. 1993). As input parameters, we used the actual conditions measured at Paranal for each observation epoch (airmass, pressure, temperature, humidity, etc.). Further details on this routine can be found in Gubler & Tytler (1998). The right ascension and declination corrections to add to the measured NACO differential astrometry of B relative to A are
  (2)For an additional discussion of the effects of atmospheric refraction on adaptive optics observations, the interested reader is referred to Roe (2002) and Helminiak (2008).
Photometric flux ratio f(A)/f(B) between A and B in the NACO 2.17 μm narrow-band filter.
Observed and model positions of δ Vel B relative to A for the epochs presented in Fig. 3 (see also Argyle et al. 2002).
3. Apparent astrometric displacement of δ Vel A
The measured relative separations between δ Vel A and B, corrected for differential atmospheric refraction, are listed in Table 1. The photometric flux ratio of the two stars is presented in Table 2. The orbital phases of the measurements with respect to the eclipsing binary Aab were computed using the following parameters from Paper II (ROCHE model): T0(HJD) = 2 452 528.950 (epoch of periastron passage) and P = 45.15023 d. The observed displacement of the CL of Aa–Ab relative to B results from the vectorial sum of the orbital motion of B on its 142-year orbit, and the displacement of the CL of the eclipsing binary system over its ≈ 45-day orbital cycle. In order to measure this second component only, the secular orbital displacement of δ Vel B relative to A must be subtracted from the measured differential astrometry.
In Paper III Mérand et al. (2011) determined the orbital elements of the δ Vel A-B system. We used these parameters to estimate the relative positions of the center of mass of δ Vel A and B at each observation epoch, and subtracted the resulting vectors from our NACO astrometric measurements. The evolution of the measured astrometric position of δ Vel B relative to A as a function of time (over more than a century) is presented in Table 3. The model positions for the different epochs are also listed, with the residuals compared to the observations.
 |
Fig. 3 Relative orbit of δ Vel B around δ Vel A. The trajectory computed using the orbital elements determined in Paper III is represented as a black ellipse, and the measurements corresponding to our NACO and VISIR astrometry are shown in the enlarged insert box. The axes are labeled in arcseconds, and the numerical values of the positions are listed in Table 3. |
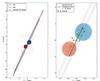 |
Fig. 4 Left: visual rendering of the Aab system close to the primary eclipse (see also Mérand et al. 2011). Right: observed astrometric displacement of the center of light of the Aab system from NACO differential astrometry (points) with the model trajectory of the center of light (thick curve). The orbital trajectories of the Aa and Ab components are represented using thin curves. The rms residual dispersion of the measurements compared to the model is 110 μas (excluding the 2008 May 05, 2008 May 07 and 2009 Jan. 07 epochs, that are also not shown on this plot, see Sect. 4.1 for details). |
Because of uncertainties in the determination of the orbital parameters of the A-B system, we added a constant astrometric shift (Δα = −0.3 mas, Δδ = 0 mas) to our CL displacement model to match the measured CL positions. To determine this constant shift, we minimized the dispersion of the 2008 measurements with respect to the model. We needed this correction, as our NACO measurements have a limited absolute accuracy caused by the plate scale uncertainty (≈ 2 × 10⁻³). For the 0.6″ separation of δ Vel A and B, this systematic uncertainty is ≈ 1 mas and it does not average out with the number of measurements. We obtained a residual rms dispersion of the NACO measurement points of 110 μas compared to our model (excluding the 2008 May 05, 2008 May 07, and 2009 Jan. 07 epochs, see Sect. 4.1).
The measured astrometric wobble of the CL of the eclipsing system is presented in Fig. 4 and the corresponding numerical values are listed in Table 4. Another view of this apparent displacement, including a plot of the differential photometry of δ Vel A-B, is shown in Fig. 5. In these two figures, the prediction from the physical model of the eclipsing pair presented in Paper III is also shown for reference. The derived orientation of the orbital plane of the eclipsing pair is consistent with the interferometric measurements reported in Paper III. The observed amplitude of the CL displacement is also in satisfactory agreement with the predicted value (≈ 2 mas).
It is interesting to note that at the phases of the eclipses in the model curves, the CL of Aab moves over small arcs because of the slight inclination of the orbital plane on the line of sight and also because of the inhomogeneous light distribution on the apparent disks of the two stars (they are both relatively fast rotators and therefore show some gravity darkening). The amplitude of this effect is too small, however, to be detectable in our NACO measurements.
4. Discussion
4.1. Inconsistent NACO measurements
The overall agreement between our NACO astrometric measurements and the model of the eclipsing pair is satisfactory. However, three of our measurement points show a significant departure from the expected CL trajectory, at epochs 2008 May 05, 2008 May 07, and 2009 Jan. 07.
For our 2009 epoch, the observed discrepancy is most probably due to the combination of two causes. The first is the instability of the field orientation of NACO over a period of more than 7 months. From the analysis of archival NACO reference astrometric fields, G. Chauvin (priv. comm.) observed that a shift of 0.30 ± 0.03 deg in the true North orientation occured between April and August 2008. We identified an intervention on the instrument in early July 2008 that explains the observed shift (although it does not affect our April–May data). Other actions took place on the instrument later in 2008, that possibly modified or removed part of this rotation shift. The second cause is that the true accuracy of the orbital trajectory of B in our model (Fig. 3) is limited by the accumulation of errors with time. Because of the uncertainties on the A–B orbital parameters, it is practically impossible to relate our 2009 measurement unequivocally to the 2008 epochs at a level of a few 10 μas. We therefore excluded the isolated 2009 epoch from the present astrometric analysis.
Astrometric displacement of the center-of-light (CL) of δ Vel A.
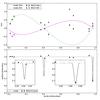 |
Fig. 5 Top: apparent displacement of the center of light of the δ Vel Aab eclipsing pair relative to B as a function of the orbital phase (the secular displacement of B has been subtracted). The two discrepant measurements around φ = 0.7 are discussed in Sect. 4.1. Bottom: ratio of the photometric fluxes of δ Vel A and B in the NACO narrow-band 2.17 μm filter (Table 2), normalized to the median measured ratio (10.372). For both plots, the solid curves are the predictions of the model presented in Paper III, and not the result of a fit to the data. |
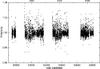 |
Fig. 6 Total flux of the δ Vel A-B system as a function of the phase from SMEI observations, excluding the eclipses, normalized to its average over the observation period. |
For the two epochs in early May 2008, however it is more difficult to reach a solid conclusion on the origin of the deviation. We considered the following possible explanations:
-
Atmospheric or instrumental effect. We checked the differentobservational parameters of all the observations, eitherenvironmental (seeing conditions, airmass, etc.) or instrumental(flat or bias properties, etc.), but we could not find a significantparticularity of the data collected over these two nights. Theobserved deviation was present over two nights separated by onlytwo days, and was not present before or after these two nights.Although a peculiar instrumental bias cannot be formallyexcluded, this points to an astrophysical origin.
-
Transit of a dark body (exoplanet or faint star). The geometry of the δ Vel A-B eclipsing system makes it a favorable configuration for the transit of dark bodies in front of the stars of the eclipsing pair. The existence of these systems was predicted by Schneider (1994), and recently demonstrated by Armstrong et al. (2012). A search for transit signatures in the photometry measured with SMEI (Fig. 6) did not give positive results down to about 2% of the total Aa+Ab+B flux. There is still a possibility that a very shallow transit of 1–2% of the total flux may be present (≈ 4 − 5% of the flux of one of the main components Aa or Ab), but it would be insufficient to explain the observed astrometric signal. So the transit of a dark component in front of one of the stars appears unlikely.
-
Activity of δ Vel Aa and/or Ab in the Brγ line. The NACO images were taken with a narrow-band Brγ filter. It is therefore possible that episodic mass loss created a temporary envelope and circumstellar emission around one of the two eclipsing stars. An emission of this kind could be faint in the broad-band photometry of the system (SMEI data), but would be much more apparent in our narrow-band Brγ filter. This would affect our astrometric measurements by displacing the CL of the eclipsing system towards the star experiencing the circumstellar emission. According to our model of the system (Paper III), the expected Brγ flux ratio between δ Vel A and B is 10.67. We measure a median value of f(A)/f(B) = 10.37 ± 0.13 over all our observations (Table 2), which is slightly below the model, but could be explained by interstellar extinction. It should be noted that the flux ratio values observed on 2008-05-05 and 05-07 are both lower than the median value (10.27 to 10.30). Moreover, the observed dispersion of the measurement points (≈ 0.13) is much larger than the uncertainty of the measurements (≈ 0.01). This means that either Aa, Ab, or B experiences photometric variability in the Brγ line. The SMEI photometry presented in Fig. 6 also shows a possible variability at a 2–3% level. If we consider only the case of a change in brightness of one of the eclipsing stars (a change in the flux of B would have no effect on the astrometry), a 1% change in total flux means a ≈ 2% change in the relative brightness of δ Vel Aa and Ab. This change in flux would result in a geometrical shift of the CL of the system of approximately 300 μas when the stars are at maximum elongation (separation ≈ 16 mas). This amplitude is similar to the observed drift of the CL on 2008 May 05 and 2008 May 07. However, the fact that we have only the relative photometry of A and B at high precision means that we cannot exclude a change in the brightness of B that would invalidate this hypothesis.
-
Binarity of δ Vel B. The presence of an undetected companion around B would cause a displacement of the photocenter of this component, and thus affect the differential A–B astrometry. The mass of the companion of B would have to be relatively high, and its orbital period short, but we cannot formally exclude this possibility. As suggested in Paper II, spatially resolved spectroscopy of δ Vel B would be necessary to check this hypothesis, as well as to confirm the physical properties of this star.
In summary, the most likely explanations for the inconsistent astrometric measurements of 2008 May 05 and 2008 May 07 are either an unidentified instrumental bias, or a transient activity of one of the fast rotating Aa or Ab stars in the Brγ hydrogen line (e.g., the temporary formation or disappearance of a disk contributing ≈ 1 − 2% of the flux in the Brγ line). The sensitivity of our differential astrometric measurements to the flux ratio of Aa and Ab introduces an additive noise on the measurement of the Aab CL displacement. Although the formal accuracy of each individual astrometric measurement is unaffected, the level of agreement with the CL displacement predicted by our model (that assumes non-variable stars) is reduced.
4.2. Astrometric accuracy
The dispersion of our NACO astrometric measurements around our model of the system (110 μas rms, excluding the 2008 May 05 and 2008 May 07 epochs, see Fig. 4) is larger than our individual measurement uncertainty (≈ 50 μas per epoch). We therefore estimate that the true accuracy of a single measurement epoch is most probably between 50 and 100 μas. This level of accuracy is consistent with the conclusions of Fritz et al. (2010). This confirms that very high-precision astrometric observations are feasible from the ground with adaptive optics systems on large telescopes. The measurements we presented were obtained on a particularly favorable object, very bright and with only two unresolved objects in the field of view. However, the detected astrometric displacement is particularly subtle, and the fact that we could retrieve the orientation of the orbital plane of the eclipsing pair demonstrates the potential of this technique.
One should also note that we used a neutral density filter and a narrow band filter to prevent the saturation of the CONICA detector. This means that the level of accuracy we demonstrated is directly applicable to significantly fainter targets than δ Vel (probably by at least 10 mag). For even fainter objects (mK > 14), particularly in the Galactic Center region, a detailed discussion is presented by Fritz et al. (2010).
5. Conclusion
We reported high precision differential astrometric measurements of the triple system δ Vel. They show that it is possible to measure the separation of close binaries of suitable brightness with a repeatable precision of 50 to 100 μas. The comparison of the measured astrometric displacement of the CL of the eclipsing component of δ Vel with a well-constrained model of the system shows that our NACO measurements give a realistic astrometric signal, in terms of amplitude and orientation on the sky. However, this qualitatively good agreement is affected by what we interpret as photometric variability of one of the components of the eclipsing binary (although other explanations are also possible).
High accuracy astrometric measurements have the potential to bring novel constraints in several fields of astrophysics, from the Galactic center (e.g., Gillessen et al. 2009), to faint companion detection (e.g., Tokovinin et al. 2012), or cluster
dynamics (e.g., Clarkson et al. 2012; Hußmann et al. 2012). The future instrumentation of extremely large telescopes (see e.g., Trippe et al. 2010) will give access to much fainter objects, although the actual measurement accuracy will probably not be improved significantly beyond the 50 μas limit. The next generation interferometric instrumentation at near-infrared wavelengths, particularly the GRAVITY (Gillessen et al. 2010; Eisenhauer et al. 2011; Vincent et al. 2011) and ASTRA (Woillez et al. 2012; Stone et al. 2012) instruments, are expected to overcome this limit, down to an accuracy of 10 to 20 μas over a field of view of a few arcseconds.
fft_fine_shift function of the fft_utils.i package
Acknowledgments
We thank the La Silla Paranal Observatory team for the successful execution of the NACO observations of δ Vel. The visual binary orbit fitting procedures we used were created by Dr Pascal Bordé. We thank Drs Gaël Chauvin and Julien Girard for their help in characterizing the stability of the astrometric calibration of NACO. This work received the support of PHASE, the high angular resolution partnership between ONERA, Observatoire de Paris, CNRS and University Denis Diderot Paris 7. This work was supported by the Slovak Research and Development Agency under the contract No. APVV-0158-11, and partially supported by the VEGA 2/0094/11 project. This research took advantage of the SIMBAD and VIZIER databases at the CDS, Strasbourg (France), and NASA’s Astrophysics Data System Bibliographic Services.
References
- Argyle, R. W., Alzner, A., & Horch, E. P. 2002, A&A, 384, 171 [NASA ADS] [CrossRef] [EDP Sciences] [Google Scholar]
- Armstrong, D., Pollacco, D., Watson, C. A., et al. 2012, A&A, 545, L4 [NASA ADS] [CrossRef] [EDP Sciences] [Google Scholar]
- Clarkson, W. I., Ghez, A. M., Morris, M. R., et al. 2012, ApJ, 751, 132; Erratum: 2012, ApJ, 753, 92 [NASA ADS] [CrossRef] [Google Scholar]
- Eisenhauer, F., Perrin, G., Brandner, W., et al. 2011, ESO Messenger, 143, 16 [Google Scholar]
- Fritz, T., Gillessen, S., Trippe, S., et al. 2010, MNRAS, 401, 1177 [NASA ADS] [CrossRef] [Google Scholar]
- Gillessen, S., Eisenhauer, F., Trippe, S., et al. 2009, ApJ, 692, 1075 [NASA ADS] [CrossRef] [Google Scholar]
- Gillessen, S., Eisenhauer, F., Perrin, G., et al. 2010, Proc. SPIE, 7734, 28 [NASA ADS] [Google Scholar]
- Gubler, J., & Tytler, D. 1998, PASP, 110, 738 [NASA ADS] [CrossRef] [Google Scholar]
- Helminiak, K. G. 2008 [arXiv:0805.3369] [Google Scholar]
- Hußmann, B., Stolte, A., Brandner, W., et al. 2012, A&A, 540, A57 [NASA ADS] [CrossRef] [EDP Sciences] [Google Scholar]
- Kervella, P., Ségransan, D., & Coudé du Foresto, V. 2004, A&A, 425, 1161 [NASA ADS] [CrossRef] [EDP Sciences] [Google Scholar]
- Kervella, P., Thévenin, F., & Petr-Gotzens, M. 2009, A&A, 493, 107 (Paper I) [NASA ADS] [CrossRef] [EDP Sciences] [Google Scholar]
- Kölher, R., Ratzka, T., & Leinert, Ch. 2012, A&A, 541, A29 [NASA ADS] [CrossRef] [EDP Sciences] [Google Scholar]
- Lenzen, R., Hofmann, R., Bizenberger, P., & Tusche, A. 1998, SPIE, 3354, 606 [Google Scholar]
- Liebe, H. J., Hufford, G. A., & Cotton, M. G. 1993, Propagation Modeling of Moist Air and Suspended Water/Ice Particles at Frequencies Below 1000 GHz, AGARD (Advisory Group for Aerospace Research & Development) Conf. Proc., 542, 3 [Google Scholar]
- Masciadri, E., Brandner, W., Bouy, H., et al. 2003, A&A, 411, 157 [NASA ADS] [CrossRef] [EDP Sciences] [Google Scholar]
- Mérand, A., Kervella, P., Pribulla, T., et al. 2011, A&A, 532, A50 (Paper III) [NASA ADS] [CrossRef] [EDP Sciences] [Google Scholar]
- Neuhäuser, R., Mugrauer, M., Seifahrt, A., Schmidt, T. O. B., & Vogt, N. 2008, A&A, 484, 281 [NASA ADS] [CrossRef] [EDP Sciences] [Google Scholar]
- Otero, S. A., Fieseler, P. D., & Lloyd, C. 2000, IBVS, 4999 [Google Scholar]
- Pribulla, T., Mérand, A., Kervella, P., et al. 2011, A&A, 528, A21 (Paper II) [NASA ADS] [CrossRef] [EDP Sciences] [Google Scholar]
- Roe, H. G. 2002, PASP, 114, 450 [NASA ADS] [CrossRef] [Google Scholar]
- Rousset, G., Lacombe, F., Puget, F., et al. 2003, Proc. SPIE, 4839, 140 [NASA ADS] [CrossRef] [Google Scholar]
- Schneider, J. 1994, Planet. Space Sci., 42, 539 [Google Scholar]
- Seifahrt, A., Röll, T., & Neuhäuser, R. 2008, Proc. 2007 ESO Instrument Calibration Workshop, Garching, Germany, 271 [Google Scholar]
- Stone, J. M., Eisner, J. A., Monnier, J. D., et al. 2012, ApJ, 754, 151 [NASA ADS] [CrossRef] [Google Scholar]
- Tokovinin, A., Hartung, M., Hayward, T. L., et al. 2012, AJ, 144, 7 [NASA ADS] [CrossRef] [Google Scholar]
- Trippe, S., Davies, R., Eisenhauer, F., et al. 2010, MNRAS, 402, 1126 [NASA ADS] [CrossRef] [Google Scholar]
- Vincent, F., Paumard, T., Perrin, G., et al. 2011, MNRAS, 412, 2653 [NASA ADS] [CrossRef] [Google Scholar]
- Woillez, J., Akeson, R., Colavita, M., et al. 2012, PASP, 124, 51 [NASA ADS] [CrossRef] [Google Scholar]
All Tables
Photometric flux ratio f(A)/f(B) between A and B in the NACO 2.17 μm narrow-band filter.
Observed and model positions of δ Vel B relative to A for the epochs presented in Fig. 3 (see also Argyle et al. 2002).
All Figures
|
Fig. 1 Average image of δ Vel obtained on 2008 Apr. 01, together with the 21 × 21 pix astrometric windows that we used for the differential astrometry (white squares). |
| In the text | |
|
Fig. 2 Geometrical effect of the atmospheric refraction on the differential astrometry of a binary star (see Sect. 2.3 for details). |
| In the text | |
|
Fig. 3 Relative orbit of δ Vel B around δ Vel A. The trajectory computed using the orbital elements determined in Paper III is represented as a black ellipse, and the measurements corresponding to our NACO and VISIR astrometry are shown in the enlarged insert box. The axes are labeled in arcseconds, and the numerical values of the positions are listed in Table 3. |
| In the text | |
|
Fig. 4 Left: visual rendering of the Aab system close to the primary eclipse (see also Mérand et al. 2011). Right: observed astrometric displacement of the center of light of the Aab system from NACO differential astrometry (points) with the model trajectory of the center of light (thick curve). The orbital trajectories of the Aa and Ab components are represented using thin curves. The rms residual dispersion of the measurements compared to the model is 110 μas (excluding the 2008 May 05, 2008 May 07 and 2009 Jan. 07 epochs, that are also not shown on this plot, see Sect. 4.1 for details). |
| In the text | |
|
Fig. 5 Top: apparent displacement of the center of light of the δ Vel Aab eclipsing pair relative to B as a function of the orbital phase (the secular displacement of B has been subtracted). The two discrepant measurements around φ = 0.7 are discussed in Sect. 4.1. Bottom: ratio of the photometric fluxes of δ Vel A and B in the NACO narrow-band 2.17 μm filter (Table 2), normalized to the median measured ratio (10.372). For both plots, the solid curves are the predictions of the model presented in Paper III, and not the result of a fit to the data. |
| In the text | |
|
Fig. 6 Total flux of the δ Vel A-B system as a function of the phase from SMEI observations, excluding the eclipses, normalized to its average over the observation period. |
| In the text | |
Current usage metrics show cumulative count of Article Views (full-text article views including HTML views, PDF and ePub downloads, according to the available data) and Abstracts Views on Vision4Press platform.
Data correspond to usage on the plateform after 2015. The current usage metrics is available 48-96 hours after online publication and is updated daily on week days.
Initial download of the metrics may take a while.