Fig. 4
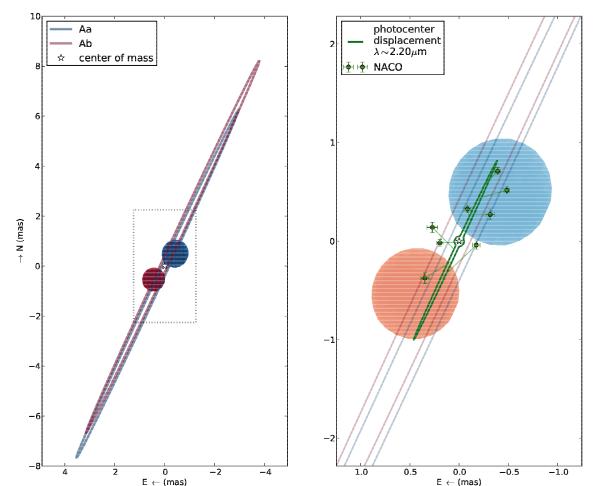
Left: visual rendering of the Aab system close to the primary eclipse (see also Mérand et al. 2011). Right: observed astrometric displacement of the center of light of the Aab system from NACO differential astrometry (points) with the model trajectory of the center of light (thick curve). The orbital trajectories of the Aa and Ab components are represented using thin curves. The rms residual dispersion of the measurements compared to the model is 110 μas (excluding the 2008 May 05, 2008 May 07 and 2009 Jan. 07 epochs, that are also not shown on this plot, see Sect. 4.1 for details).
Current usage metrics show cumulative count of Article Views (full-text article views including HTML views, PDF and ePub downloads, according to the available data) and Abstracts Views on Vision4Press platform.
Data correspond to usage on the plateform after 2015. The current usage metrics is available 48-96 hours after online publication and is updated daily on week days.
Initial download of the metrics may take a while.