Fig. 9
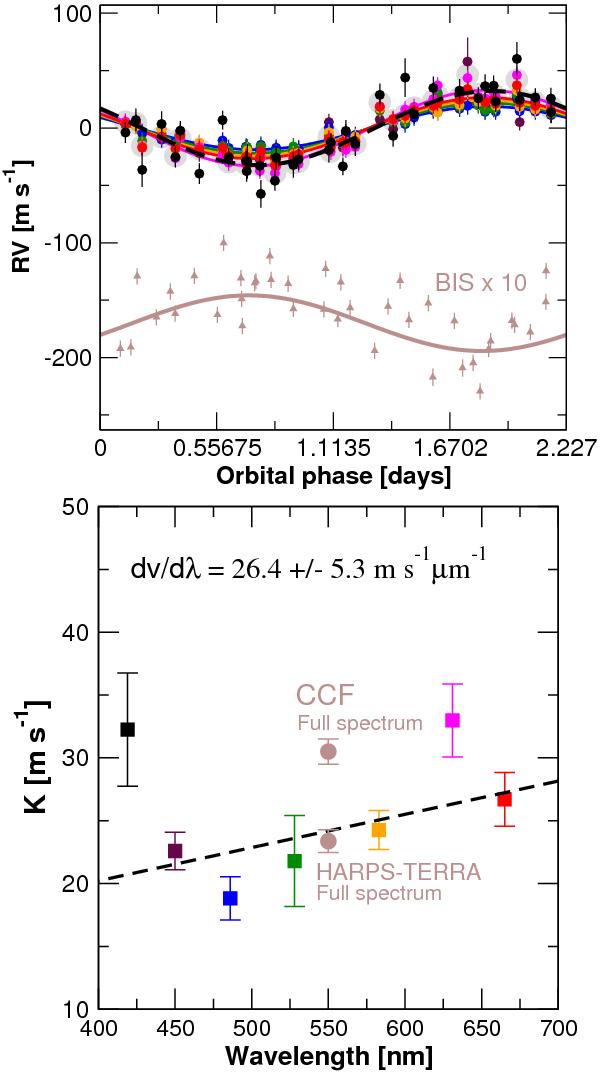
Upper panel: phase-folded RVs and fitted signals to the preferred Doppler period of 2.22704 d. The phase-folded fit to the BIS is also provided. For illustration purposes the BIS data have been shifted and multiplied by 10. Right panel: semi-amplitude K of the signal as a function of wavelength. The best fit to a linear model representing the wavelength dependence of K is given as a thick dashed line. The semi-amplitudes derived from the full spectrum (using CCF and HARPS-TERRA measurements) are also shown as solid brown circles. Note that both measurements provide incompatible results, which provides yet another test to assess the reality of a Doppler signal.
Current usage metrics show cumulative count of Article Views (full-text article views including HTML views, PDF and ePub downloads, according to the available data) and Abstracts Views on Vision4Press platform.
Data correspond to usage on the plateform after 2015. The current usage metrics is available 48-96 hours after online publication and is updated daily on week days.
Initial download of the metrics may take a while.