Fig. 6
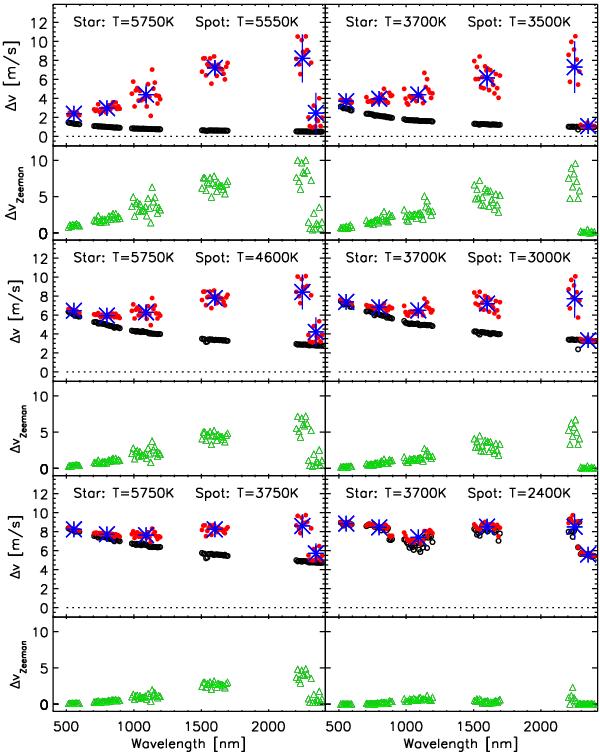
Radial velocity amplitude due to co-rotating cool magnetic spots (f = 1%, B = 1000 G, v sini = 2 km s-1) using our synthetic atmosphere model for different star/spot temperatures. Black circles show the influence of temperature only (B = 0), red circles show the net effect including temperature contrast and Zeeman broadening in the spot. Blue crosses are average values and ranges for six wavelength bands. Green triangles show residuals between red and black circles, i.e., the effect caused by Zeeman broadening. Left panel shows a sun-like star with T = 5750 K, right panel shows an early M-type star with T = 3700 K. Top to bottom panels show different values of ΔT = Tstar − Tspot; top panel: ΔT = 200 K; middle panel: ΔT ≈ T/5; bottom panel: ΔT ≈ T/3.
Current usage metrics show cumulative count of Article Views (full-text article views including HTML views, PDF and ePub downloads, according to the available data) and Abstracts Views on Vision4Press platform.
Data correspond to usage on the plateform after 2015. The current usage metrics is available 48-96 hours after online publication and is updated daily on week days.
Initial download of the metrics may take a while.