Fig. 10
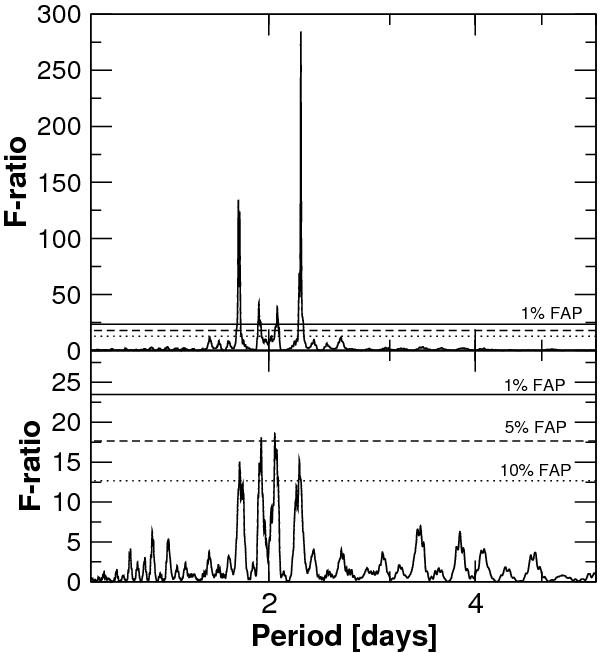
Top: periodogram of the RVs obtained using the full spectral range of HARPS. Bottom: periodogram of the BIS. The 1% FAP threshold is illustrated as solid horizontal lines in both panels. The four peaks in the bottom panel are likely strong aliases of the same signal (2.22 days would be compatible with the photometric period of the star). Note that their average FAP is only 5%.
Current usage metrics show cumulative count of Article Views (full-text article views including HTML views, PDF and ePub downloads, according to the available data) and Abstracts Views on Vision4Press platform.
Data correspond to usage on the plateform after 2015. The current usage metrics is available 48-96 hours after online publication and is updated daily on week days.
Initial download of the metrics may take a while.