Fig. 2
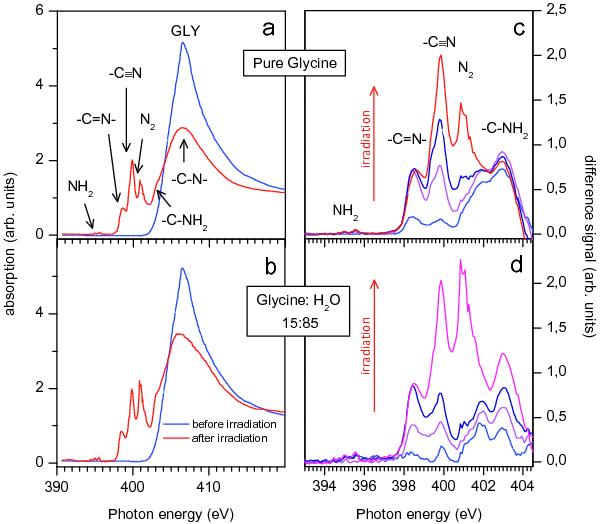
NEXAFS spectra at the nitrogen K-edge of pure glycine (top), 15% glycine in water ice (bottom), before and at the end of the irradiation. On the right panels are shown the difference spectra (irradiated minus non irradiated), at selected doses; pure glycine 0.30; 0.91; 1.52; 2.54 equivalent time of solar irradiation (year); 15% glycine dilution 0.36; 1.0; 1.72 years. The red arrows indicate how the peaks grow when the irradiation proceeds.
Current usage metrics show cumulative count of Article Views (full-text article views including HTML views, PDF and ePub downloads, according to the available data) and Abstracts Views on Vision4Press platform.
Data correspond to usage on the plateform after 2015. The current usage metrics is available 48-96 hours after online publication and is updated daily on week days.
Initial download of the metrics may take a while.