Fig. 11
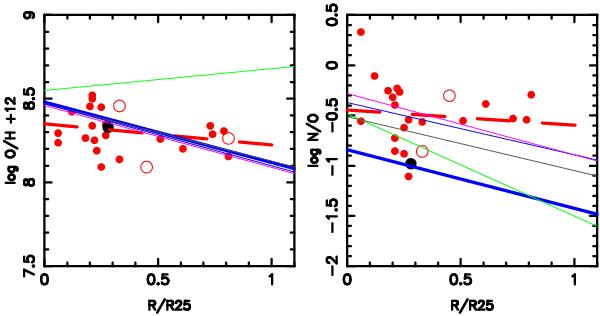
Observed and predicted radial trends of O/H and N/O in the PNe of NGC 300. The thin lines show the predicted trends assuming that the progenitor initial abundances follow the regression line for H ii regions (represented with the thick blue line). The different colors correspond to the different stellar evolution models listed in Table 9: green for Marigo (2001), grey for Karakas (2010), blue for the standard models of Lagarde et al. (2012), purple for the models with rotation of Lagarde et al. (2012). The thick dashed lines shows is regression line for the observed PN abundances.
Current usage metrics show cumulative count of Article Views (full-text article views including HTML views, PDF and ePub downloads, according to the available data) and Abstracts Views on Vision4Press platform.
Data correspond to usage on the plateform after 2015. The current usage metrics is available 48-96 hours after online publication and is updated daily on week days.
Initial download of the metrics may take a while.