Free Access
Fig. 8
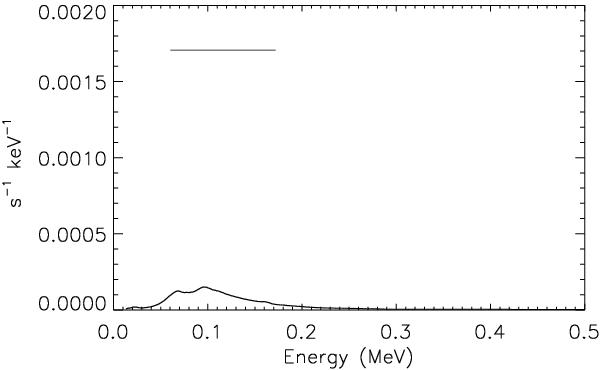
ISGRI expected rate spectrum from a DDTe model averaged over the last 6 days of the first observation period. The 3σ ISGRI upper limit for the 60–172 keV band is displayed as a horizontal bar.
Current usage metrics show cumulative count of Article Views (full-text article views including HTML views, PDF and ePub downloads, according to the available data) and Abstracts Views on Vision4Press platform.
Data correspond to usage on the plateform after 2015. The current usage metrics is available 48-96 hours after online publication and is updated daily on week days.
Initial download of the metrics may take a while.