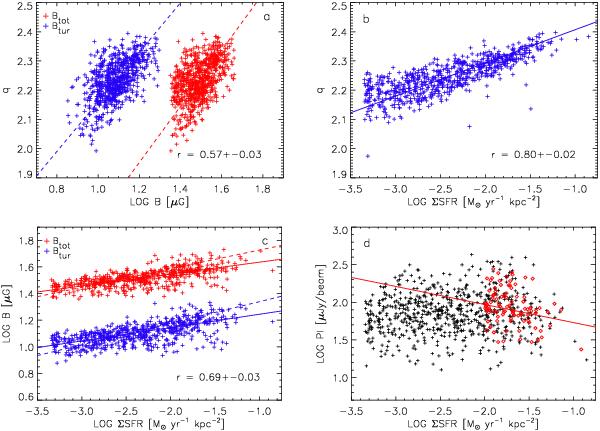
Fig. 9

Radio-IR correlation (q-parameter) versus total and turbulent magnetic field strength a) and star formation surface density ΣSFRb). The magnetic field strength-ΣSFR relation is shown for the total, turbulent c), and the ordered magnetic field strength measured by the degree of polarization d). The lines in the upper panels are the bisector fits. The solid lines in c) and d) show the ordinary least square fit, and the dashed line the bisector fit. In panel d), the binned data points (diamonds) are fitted for ΣSFR ≳0.01 M⊙ yr-1 kpc-2 (solid line). In panels a) and c), the total magnetic field is shifted up by 0.3 units for clarity. The nucleus is not included in these analysis.
Current usage metrics show cumulative count of Article Views (full-text article views including HTML views, PDF and ePub downloads, according to the available data) and Abstracts Views on Vision4Press platform.
Data correspond to usage on the plateform after 2015. The current usage metrics is available 48-96 hours after online publication and is updated daily on week days.
Initial download of the metrics may take a while.


