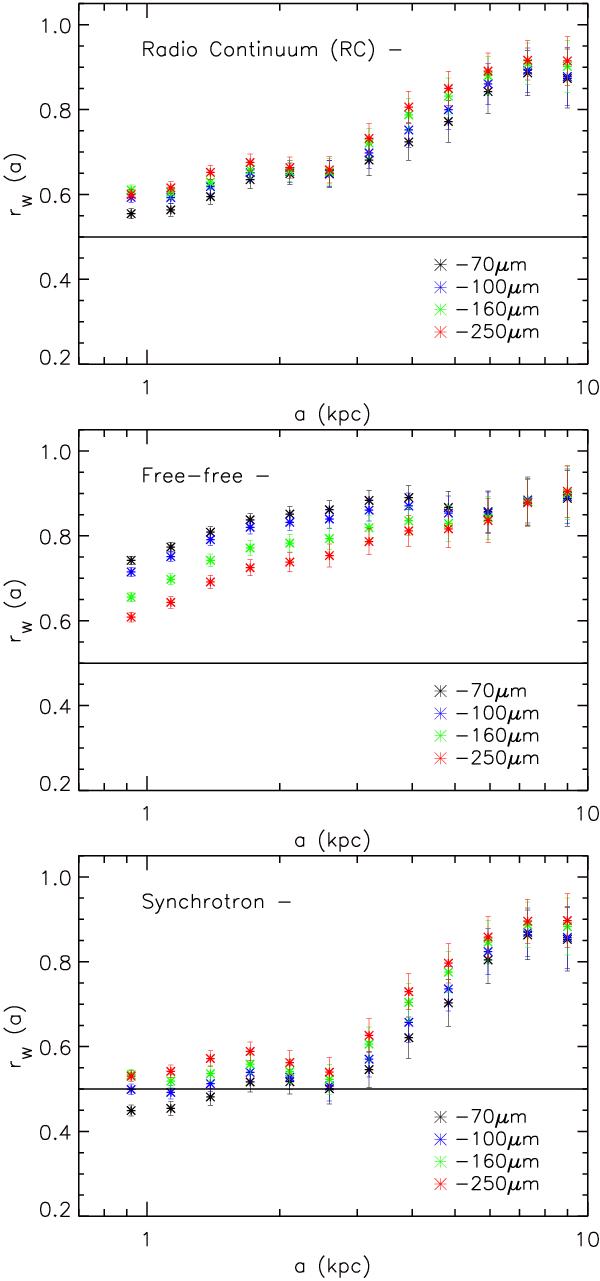
Fig. 7

Scale-by-scale correlation between the FIR emission and the observed 20 cm RC (top), the free-free (middle), and the synchrotron (bottom) emissions in NGC 6946. The horizontal line shows rw = 0.5, the threshold for detecting a correlation. Larger rw(a) corresponds to more highly correlated structures. These figures illustrate that, on scales smaller than 4 kpc, the FIR-synchrotron correlation is weaker than the FIR-free-free correlation.
Current usage metrics show cumulative count of Article Views (full-text article views including HTML views, PDF and ePub downloads, according to the available data) and Abstracts Views on Vision4Press platform.
Data correspond to usage on the plateform after 2015. The current usage metrics is available 48-96 hours after online publication and is updated daily on week days.
Initial download of the metrics may take a while.


