Fig. 8
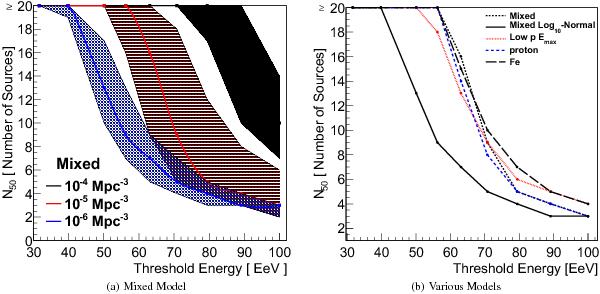
Number of sources (starting from the highest percentage contributor) that provide at least 50% of the total flux, N50%, as a function Emin, the minimum event energy. In panel a), N50% is shown for a mixed-composition model with source densities of ns = 10-4,10-5,and 10-6 Mpc-3. Panel b) shows N50% for a source density of ns = 10-5 Mpc-3 for each model and, in addition, a mixed-composition model with source luminosities distributed according to a log10-normal distribution with σ = 1. The shaded contours show the region in which 68% of all realizations lie; it is omitted in the second figure for clarity.
Current usage metrics show cumulative count of Article Views (full-text article views including HTML views, PDF and ePub downloads, according to the available data) and Abstracts Views on Vision4Press platform.
Data correspond to usage on the plateform after 2015. The current usage metrics is available 48-96 hours after online publication and is updated daily on week days.
Initial download of the metrics may take a while.