| Issue |
A&A
Volume 552, April 2013
|
|
|---|---|---|
| Article Number | A127 | |
| Number of page(s) | 7 | |
| Section | Stellar structure and evolution | |
| DOI | https://doi.org/10.1051/0004-6361/201220161 | |
| Published online | 15 April 2013 | |
Deep optical imaging of the γ-ray pulsar J1048–5832 with the VLT⋆,⋆⋆
1 Ioffe Physical Technical Institute, Politekhnicheskaya 26, 194021 St. Petersburg, Russia
e-mail: This email address is being protected from spambots. You need JavaScript enabled to view it.
; This email address is being protected from spambots. You need JavaScript enabled to view it.
2 St. Petersburg State Polytechnical Univ., Politekhnicheskaya 29, 195251 St. Petersburg, Russia
e-mail: This email address is being protected from spambots. You need JavaScript enabled to view it.
; This email address is being protected from spambots. You need JavaScript enabled to view it.
3 The Oskar Klein Centre, Department of Astronomy, Stockholm University, AlbaNova, 106 91 Stockholm, Sweden
Received: 3 August 2012
Accepted: 31 January 2013
Abstract
Context. PSR J1048–5832 is a young radio-pulsar that has recently been detected in γ-rays with Fermi, and also in X-rays with Chandra and XMM-Newton. It powers a compact pulsar wind nebula visible in X-rays and is in many ways similar to the Vela pulsar.
Aims. We present deep optical observations made with the ESO Very Large Telescope to search for optical counterparts of the pulsar and its nebula and to explore their multi-wavelength emission properties.
Methods. The data were obtained in the V and R bands and were compared with archival data in other spectral domains.
Results. We do not detect the pulsar in the optical and derive informative upper limits of R ≳ 28.m1 and V ≳ 28.m4 for its brightness. Using a red-clump star method, we estimate an interstellar extinction towards the pulsar of AV ≈ 2 mag, which is consistent with the absorbing column density derived from X-rays. The respective distance agrees with the dispersion measure distance. We reanalysed the Chandra X-ray data and compared the dereddened upper limits with the unabsorbed X-ray spectrum of the pulsar. We find that regarding its optical-X-ray spectral properties this γ-ray pulsar is not distinct from other pulsars detected in both ranges. However, like the Vela pulsar, it is very inefficient in the optical and X-rays. Among a dozen optical sources overlapping with the pulsar X-ray nebula we find one with V ≈ 26.m9 and R ≈ 26.m3, whose colour is slightly bluer than that of the field stars and is consistent with the peculiar colours typical for pulsar nebula features. It positionally coincides with a relatively bright feature of the pulsar X-ray nebula, resembling the Crab wisp and is located in ~2 from the pulsar. We suggest this source as a counterpart candidate to the feature.
Conclusions. Based on the substantial interstellar extinction towards the pulsar and its optical inefficiency, additional optical studies should be carried out at longer wavelengths.
Key words: stars: neutron / ISM: supernova remnants / pulsars: individual: PSR J1048-5832
Based on observations made with ESO telescope at the Paranal Observatory under Programs 384.D-0386(A) and 386.D-0585(A).
FITS files for the fully processed images are available at the CDS via anonymous ftp to cdsarc.u-strasbg.fr (130.79.128.5) or via http://cdsarc.u-strasbg.fr/viz-bin/qcat?J/A+A/552/A127
© ESO, 2013
1. Introduction
Rotation-powered pulsars are believed to be the most numerous of all γ-ray sources in the Galaxy. Nevertheless, only about ten pulsars were discovered in γ-rays until the launch of the Fermi Gamma-ray Space Telescope (Thompson 2008). The number of γ-ray pulsars has now increased almost tenfold, including many that have not yet been identified in the radio range1. The majority of the early known γ-ray pulsars are also identified in the optical and X-rays. This provides a unique possibility to compile multi-wavelength spectra and light curves for these objects to study the not yet clearly understood radiative mechanisms responsible for the pulsar emission. Only six such multi-wavelength objects are detected in the optical. Increasing the number of optically identified γ-ray pulsars is highly desirable and the Fermi discoveries open up a new window for that.
The first Fermi catalogue (Abdo et al. 2010) provided poor accuracy (several arc-minutes) of the source spatial localisation. Therefore only the new γ-ray pulsars whose coordinates were known with higher accuracy from radio and/or X-ray observations were suitable for optical counterpart searches. Here we present optical follow-up observations of one of the “radio-selected” Fermi-pulsars, PSR J1048–5832 (B1046−58), obtained with the ESO Very Large Telescope (VLT). This is a 124 ms Vela-like radio-pulsar with a characteristic age of 20.4 kyr and a spin-down luminosity of 2 × 10 erg s, discovered in the radio by Johnston et al. (1992) and later in X-rays by Gonzalez et al. (2006). It was mentioned as a low-significance γ-ray pulsar in the Third EGRET catalogue (Thompson 2008) but was confirmed with Fermi (Abdo et al. 2010). The dispersion measure (DM) of 129 pc cm implies a distance ≈2.7 kpc. A faint, presumably tail-like pulsar wind nebula (PWN) was also detected around the pulsar in X-rays (Gonzalez et al. 2006).
We imaged the pulsar field in the V and R bands. Mignani et al. (2011) reported their non-detection of an optical counterpart based on our V-band data only. Here we analyse the data in both bands and examine colours of optical sources located close to the pulsar and within its PWN extent. We confirm the non-detection in the V band and derive deep optical flux upper limits for the pulsar in both bands within its 1σ position uncertainty in X-rays. The observations and data reduction are described in Sect. 2, our results are presented in Sect. 3 and are discussed in Sect. 4.
2. Observations and data reduction
Log of the VLT/FORS2 observations of PSR J1048–5832.
2.1. Observations
The pulsar field was imaged in the VHIGH and RSPECIAL bands with the FOcal Reducer and low dispersion Spectrograph (FORS22) at the VLT/UT1 (ANTU) during several service mode runs in 2010 and 2011 (see Table 1). The observations were performed with the standard resolution collimator providing a pixel size of 0 25 (2 × 2 binning) and a field size of 6
 8 × 68. Sets of twelve- and ten-minute dithered exposures were obtained in the V and R bands, respectively. Three short, 15 s exposures were taken in the V band to minimise the number of saturated sources in the crowded pulsar field and were used for astrometry. The observing conditions were photometric during the runs, with seeing varying from 04 to 10.
Standard data reduction, including bias subtraction, flat-fielding, cosmic-ray removal, and geometric distortion corrections, was performed with the IRAF and MIDAS tools. We then aligned and combined all individual frames in each band, using a set of unsaturated stars. The alignment accuracy was ≲ 0.1 of a pixel. The resulting mean seeing values were 063 and 064, and the integration times were 24 and 16.8 ks for the combined V and R images, respectively.
2.2. Astrometric referencing
For astrometric referencing the shallow V-band (Table 1) images were used. The positions of the astrometric standards from the USNO-B1 astrometric catalogue3 were used as a reference. To minimise uncertainties caused by overlapping stellar profiles in the crowded field-of-view (FOV), we selected only 15 isolated non-saturated stars. Their pixel coordinates were derived using the IRAF task imcenter with an accuracy of ≲ 0.007 pixels. The IRAF task ccmap, allowing for the image scaling, shift, and rotation, was applied for the astrometric transformation of the image. Formal rms uncertainties of the astrometric fit were ΔRA ≲ 0056 and ΔDec ≲ 0060, and the fit residuals were ≲ 017, consistent with the nominal catalogue uncertainty of ≈ 02. The combined deep V and R images were aligned to the short V reference frame with an accuracy of ≲ 001. The resulting conservative 1σ referencing uncertainty for the combined images is ≲02 in both RA and Dec.
To compare optical and X-ray data, we also performed astrometric referencing of the best spatial resolution archival X-ray image of PSR J1048–5832 obtained with Chandra/ACIS4. In the exposure-corrected ACIS-S3 chip image, where the pulsar is located, we found twelve point-like objects detected at ≳3σ significance. We identified them with relatively bright optical reference objects from the USNO-B1 catalogue. Their image positions were defined using the CIAO celldetect tool with an accuracy of 0.5–3.0 of the ACIS pixel size ( ≈ 05). Resulting formal rms uncertainties of the astrometric fit were ΔRA ≈ 0424 and ΔDec ≈ 022 with maximal residuals ≲ 083 and ≲ 054 in RA and Dec. Combining the latter with the catalogue uncertainties, conservative 1σ X-ray image astrometric uncertainties are ΔRA ≲ 085 and ΔDec ≲ 058. The shift between the raw and transformed images was insignificant, ~ 01.
Using celldetect we obtained the coordinates of the point-like pulsar X-ray counterpart, RA = 10:48:12.640 and Dec = − 58:32:03.50, which are compatible with those reported by Gonzalez et al. (2006). The radii and positional angle of the 1σ-error ellipse of the source position are 0335, 0266, 168 663. Accounting for the image referencing uncertainties, we estimate a conservative pulsar X-ray coordinate errors of 092 and 064 in RA and Dec. Combining them with the optical referencing uncertainty, we obtained the RA and Dec radii of the 1σ-error ellipse of the pulsar X-ray position on the optical images as 094 and 067.
2.3. Photometric calibration
The photometric calibration was carried out using standard stars from the photometric standard fields E3, NGC2298, NGC2437, and PG1525 (Stetson 2000) observed during the same nights as the target. We fixed the atmospheric extinction coefficients at their mean values adopted from the VLT home page: kV = 0 14 ± 001 and kR = 009 ± 001. The resulting magnitude zero-points for the combined images were VZP = 27.m97 ± 0.m02 and RZP = 28.m12 ± 0.m02, and colour-term coefficients in the respective photometric equations5 are 0.15 ± 0.03 and − 0.01 ± 0.03. The errors include the statistical measurement and extinction coefficient uncertainties, as well as marginal variations from night to night.
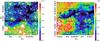 |
Fig. 1 Field of PSR J1048–5832 obtained in the V band with the VLT (left), and in Hα with the CTIO (right). The dark horizontal lines in the VLT image are due to a gap between the two FORS2/CCD chips and dithered exposures. The box in the Hα image shows the VLT FOV. The red and black crosses are the positions of J1048 − 5832 and a nearby neutron star RRAT J1047 − 5841. |
3. Results
3.1. Overview of the pulsar field
The ~6 × 6 VLT FOV in the V band (left panel of Fig. 1) shows a complicated structure of the pulsar environment with a dark feature extended over the entire field. This is also seen in the R band and is fully consistent with a large-scale structure in the Hα archival image6 (right panel of Fig. 1). The pulsar is near the middle of its eastern part. In the Spitzer archival images at 8 and 24 μm7 the dark part is filled with bright infrared emission, likely a signature of a warm dust, which is typical for star-forming regions. Another neutron star, RRAT J1047−58 is located ~15 from the pulsar. Its distance ≈2.33 kpc (Keane et al. 2011) is similar to that of J1048 − 5832. Both objects are only 15 northwards of the centre of the Carina complex, one of the largest H II regions in our Galaxy at a distance of ~2.3 kpc (Smith 2006). It contains a neutron star, 2XMM J104608.7 − 594306 (Pires et al. 2012), and six potential neutron stars candidates (Townsley et al. 2011) showing past supernova activity. The complicated J1048 − 5832 environment is thus likely linked to the northern edge of the Carina complex.
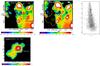 |
Fig. 2 The ~14 × 14 fragment of the VLT V (top-left) and R (top-middle) band optical, and Chandra 0.5–7 keV X-ray (left-bottom) images of the PSR J1048–5832 vicinity. The Chandra image is smoothed with a four-pixel Gaussian kernel. Colour-bars show brightness scales in 1000 counts in the optical and in counts in X-rays. The cross marks the X-ray position of the pulsar. White-dashed and black-dashed ellipses show its 1σ uncertainties in X-rays and two radio observations. Yellow contours in the R-band image are overlaid from the X-ray image to indicate the PWN structure. Optical sources overlapping with the error ellipses and X-ray PWN are labelled by numbers. Top-right: the observed colour–magnitude diagram of PSR J1048–5832 field stars. The stars labelled in the images are highlighted. |
3.2. Examining the pulsar vicinity
In Fig. 2 we compare images of the pulsar vicinity in the VR bands and X-rays. The X-ray image is corrected for the ACIS exposure map and smoothed with a four-pixel Gaussian kernel to highlight the PWN shape. The X-ray position of the pulsar and its 1σ uncertainty are marked together with the radio interferometric (Stappers et al. 1999)8 and timing (Wang et al. 2000)9 ones. The X-ray position agrees well with the interferometric one. This fact and our accurate X-ray astrometric referencing allow us to use the X-ray position as a reliable reference point in searching for the pulsar counterpart. The timing position is shifted significantly and likely suffers from systematic errors. The contours of the brightest regions and the outer boundary of the X-ray PWN are overlaid on the R image.
We did not resolve any reliable optical source within the pulsar 1σ X-ray error ellipse, but there are several optical sources overlapping with the PWN and radio ellipses. They are labelled by numbers and can be considered as potential counterparts of the pulsar, if it has a high proper motion, or its PWN structures.
3.3. Photometry and colour–magnitude diagram
Pulsars and PWNe typically have peculiar colours as compared to stars. To investigate whether the marked sources are associated with the pulsar and/or its PWN we performed point spread function (PSF) photometry using the psf and allstar tasks of the IRAF DAOPHOT package (Stetson 1987). We set the psf-radius at ten pixels, where the bright isolated unsaturated stars selected for the PSF-construction merged with the background. The fit-rad and aperture radius for the PSF stars and the preliminary aperture photometry of the other stars were 2.5 pixels, while the annulus/dannulus for local background extractions were 15/10 pixels. We made aperture corrections based on photometry of bright unsaturated isolated field stars.
The derived 3σ detection-limits for a point-like object for a half-arcsecond aperture centred at the pulsar X-ray position are Vup ≈ 28.m4 and Rup ≈ 28.m1, accounting for the aperture corrections. Magnitudes of the sources marked in Fig. 2 and the above upper limits are collected in Table 2 where uncertainties include the measurement and calibration errors. The magnitudes were transformed into flux densities using zero-points from Fukugita et al. (1995).
Comparing the V magnitudes of stars 6 and 7 to those estimated by Mignani et al. (2011, stars D and C, we find that for star 7 (C), overlapping with the pulsar timing position, their estimate, ~24.m, is consistent with ours, 23.m92 ± 0.02. However, their reported magnitude for the fainter object 6 (D) is about 0.m5 fainter than our measurement.
The output of the allstar task was also used for photometry of field stars and construction of the colour–magnitude diagram (Fig. 2). To exclude unresolved blends, partially resolved galaxies, saturated stars, and stars incorrectly cross-identified in both bands, we selected only the stars with the allstar output parameters satisfying the following conditions: χ2 ≲ 1.5; sharpness ≲1; position differences in V and R bands ≲ 0.7 pixel. These criteria were also fulfilled for the sources listed in Table 2. The resulting sample contains about 3000 stars. The objects with magnitudes ≲ 20.m5 are saturated and not included. The sources from the pulsar vicinity are highlighted in the diagram and numbered as in the images. All of them, except possibly source 5, are well within the distribution formed by the majority of field stars. They likely belong to the main-sequence branch and, thus, are unlikely to be associated with the pulsar.
Within the uncertainties the colour V − R = 0.6 ± 0.3 of source 5 is compatible with the V − R ≲ 0.7 typical for pulsar/PWNe optical counterparts, which are usually detected as faint blue objects. For instance, V − R is 0.4 for the Crab pulsar (Percival et al. 1993) and 0.7 for its PWN knot (Sandberg & Sollerman 2009). An association with the point-like pulsar is, however, excluded because of the large offset, 17 ± 07, from the pulsar X-ray position. At d = 2.7 kpc this would imply an unrealistically high pulsar transverse velocity of 3100 ± 1300 km s on the 7 yr time-base between the Chandra and VLT observations. The absence of any significant shift on the 6 yr time-base between the interferometric and X-ray positions excludes such a motion.
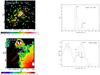 |
Fig. 3 Non-smoothed Chandra image (top) and star-subtracted VLT image (bottom). Magenta contours are X-ray contours of the PWN from Fig. 2. The cross and dashed ellipse are the position of the pulsar and its 1σ uncertainty. The yellow contour marks a relatively bright X-ray structure of the PWN 2 south-east of the pulsar, presumably a Crab-like wisp. It spatially coincides with the optical source 5, as can also be seen from the spatial brightness profiles extracted from a slice along the PWN major axis (a white-dashed rectangular in both images) presented in the left panels, where vertical dotted lines indicate the X-ray positions of the pulsar and the wisp. Error-bars indicate typical brightness uncertainties. |
3.4. Possible counterpart of the PWN
In Fig. 3 we compare the non-smoothed X-ray image of the pulsar vicinity with that in the R band where background stars were subtracted except for source 5. There is a 4-σ significance compact X-ray structure within the PWN about 20 southeast of the pulsar. The structure is outside the pulsar PSF FWHM and contains ~12–14 source counts within the yellow region constraining its boundaries. It is reminiscent of the wisps in the Crab PWN observed in the optical and X-rays. The structure is labelled as “wisp ?” and yields an apparent drop-like shape of the brightest region around the pulsar in the smoothed X-ray image of Fig. 2. It spatially coincides with source 5. This is underlined by the yellow X-ray region overlaid on the optical image and by the spatial brightness profiles along the major PWN axis (right panels of Fig. 3). The putative wisp can also be resolved in the X-ray profile published by Gonzalez et al. (2006), although it is less pronounced.
The number density of sources observed within the VLT FOV in the brightness range 26.m9 ≲ V ≲ 28.m4, consistent with the source 5 brightness, is ~ 0.008 objects arcsec. The respective confusion probability to find an unrelated point-like optical source within the 90% Chandra positional uncertainty ellipse of the putative wisp is ~2% and it becomes considerably smaller, ~0.2%, if we additionally constrain the colour (V − R) ≲ 0.9, as for source 5.
There are no other reliable potential counterparts of the PWN in our star-subtracted images. A 1.5σR flux enhancement seen within the pulsar X-ray error ellipse may indicate the presence of a faint pulsar counterpart candidate, but is consistent with a background fluctuation and the pulsar upper limits derived above.
3.5. Re-examination of the X-ray spectra
It is useful to compare the pulsar optical upper limits with its X-ray spectral data. Gonzalez et al. (2006) reported a spectral analysis of available Chandra and XMM-Newton data, but only for the combined emission of the pulsar+PWN system. To examine the X-ray spectrum of the pulsar itself we performed an independent analysis. We first reanalysed the pulsar+PWN spectrum using the data from both instruments. Our results are fully consistent with the previously published ones. The spectrum is described by an absorbed power-law, whereas the blackbody model gives an unrealistically high neutron star temperature.
We then focused on the Chandra/ACIS data where the pulsar is spatially resolved from the PWN (Fig. 3). We used the three apertures shown in Fig. 4 to extract the spectra of the pulsar, the pulsar+PWN system, and the south-east tail of the PWN. The numbers of source counts were 71 ± 9, representing ≳ 80% of the emission from the point-like pulsar, 176 ± 5, and 50 ± 9. The background was extracted from a 15 circular aperture located ~40 north-east of the pulsar in a region free from any sources. We fitted the absorbed power-law model to the extracted unbinned spectra in the 0.5–10.0 keV range using the Xspec v.12.7.1 (Arnaud 1996) and C-statistics (Cash 1979; Wachter et al. 1979). Along with the C values the fit qualities were estimated using the goodness task10. The best-fit parameters, C values, and energy bin numbers (nbins) are presented in Table 3. The pulsar+PWN fit agrees with that obtained by Gonzalez et al. (2006).
There is a noticeable increase of the absorbing column density NH when we move from the point-like pulsar to the extended PWN. This increase is significant for the south-east tail, which overlaps with the optically dark region in Fig. 2 and, therefore, is most strongly absorbed also in X-rays. The pulsar and north-western part of the PWN are in a more transparent region and NH is lower for the pulsar and has an intermediate value for the entire system. We therefore propose that the NH derived from the 15 aperture is more realistic for the pulsar than the value higher by a factor of 2 obtained from the analysis of the pulsar+PWN spectrum.
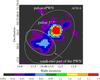 |
Fig. 4 Fragment of the Chandra/ACIS image of the PSR J1048–5832 field, where ellipses mark the apertures used to extract spectra of the pulsar and PWN. |
3.6. The interstellar extinction
The next step was to deredden the optical data. NH values from Table 3 and a standard relation between NH and the extinction factor AV (Predehl & Schmitt 1995) yield an AV of 3.4 , 10.6
 , and 1.8
 for the pulsar+PWN, PWN tail, and pulsar. The first value is nearly equal to the entire Galactic extinction of 3.6 mag along the pulsar line-of-sight (Schlegel et al. 1998). The second one is significantly higher, in agreement with the absence of any stars in the dark region overlapping with the tail. The pulsar itself is apparently less reddened. To verify this, we made independent AV estimates using a method based on the red-clump stars as standard candles, which provides an AV-distance relation for a given position on the sky (see e.g. López-Corredoira et al. 2002).
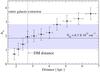 |
Fig. 5 AV-distance relation towards PSR J1048–5832. The vertical dashed line corresponds to the DM distance to the pulsar of 2.7 kpc. The hatched region and horizontal solid line show the confidence interval of AV resulting from the uncertainty interval of NH and its best-fit value for the pulsar presented in Table 3. The entire galactic extinction is indicated by the dash-dotted line. |
We extracted stars located within 0.3 of the pulsar position from the 2MASS All-Sky Point Source Catalogue11, and created a colour–magnitude diagram, K vs. J − K. We found mean J − K colours of the red-clump branch in several magnitude bins and transformed them to the AV-distance relation, as has been done by Danilenko et al. (2012) for another γ-ray pulsar J1357 − 6429. At a large distance limit this relation (Fig. 5) agrees with the entire Galactic extinction in this direction. For the DM pulsar distance of 2.7 kpc (the vertical dashed line in Fig. 5) it suggests AV ≈ 2, which is consistent with the X-ray spectral fit (the horizontal solid line) and with a mean foreground AV ≈ 1.7 for the Carina complex (Hillier et al. 2001).
Within the dark regions discussed above, AV is obviously higher (cf. Povich et al. 2011), but these have a negligible contribution to the derived relation dominated by more transparent regions, in one of which the pulsar is located.
We thus consider AV ≈ 1.8, NH ≈ 3 × 10 cm, and d ≈ 2.7 kpc as the most appropriate values, and hereafter use them to compile the multi-wavelength spectrum and to estimate luminosity of PSR J1048–5832.
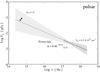 |
Fig. 6 Unabsorbed multi-wavelength spectrum of PSR J1048–5832 compiled from data obtained with the Chandra and VLT. The X-ray part with its uncertainties (hatched regions) is extrapolated to the optical. Black triangles are optical flux upper limits. |
3.7. Multi-wavelength spectrum and luminosities
The unabsorbed multi-wavelength spectrum of the pulsar is shown in Fig. 6. Its X-ray part is obtained with NH frozen at the value of 3 × 10 cm, and the optical data are dereddened with AV = 1.8. Our upper limits show that the real optical fluxes of the pulsar cannot significantly exceed the extrapolation of its X-ray spectrum to the optical range. This is typical for non-thermal radiation from pulsars detected in the optical and X-rays, including the Crab (Sandberg & Sollerman 2009), Vela (Shibanov et al. 2003), some middle-aged (Shibanov et al. 2006), and old pulsars (Zharikov et al. 2004; Zavlin & Pavlov 2004).
According to spectral fits, the pulsar X-ray luminosity in the 2–10 keV range at d = 2.7 kpc,  ≈ 10 erg s, and the pulsar to pulsar+PWN X-ray luminosity ratio ≈ 0.46 are very similar to those of ≈ 10 erg s and 0.34 obtained for the Vela pulsar, which has a similar age and spin-down luminosity. Comparing this together with our constraints of optical luminosity Lopt ≲ 10 erg s and the efficiency of transformation of its spin-down luminosity Ė to optical photons Lopt/Ė ≲ 10 with the data available for other pulsars detected in the optical and X-rays (Zharikov et al. 2004; Danilenko et al. 2012), we conclude that, like the Vela pulsar, PSR J1048–5832 is rather inefficient in the optical and X-rays (Fig. 7).
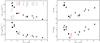 |
Fig. 7 Comparison of X-ray and V-band luminosities and efficiencies for pulsars of different characteristic age τ detected in both spectral domains. Different pulsars are marked by different symbols. PSR J1048–5832 is shown by the red star. The two dependencies of the pulsar efficiencies with age demonstrate an efficiency minimum near the Vela age, and the Vela-like J1048 − 5832 naturally occupies a place near this minimum. |
4. Discussion and conclusions
We did not detect PSR J1048–5832 in our deep optical images of the field down to a visual magnitude of ~28. The pulsar is located in a complicated region linked to the northern edge of the Carina complex with high star formation (and supernova) activity (Fig. 1). The region is filled by clumpy clouds where the interstellar extinction and absorbing column density vary substantially even at a 10 scale. This complicates the optical identification of the pulsar and its PWN. Nevertheless, the derived pulsar optical flux upper limits are quite informative.
First, our VLT observations and re-analysis of the X-ray data showed (Fig. 6) that the optical fluxes of the pulsar do not exceed the extrapolation of its power law X-ray spectrum towards the optical range, which is compatible with multi-wavelength non-thermal spectra for other rotation-powered pulsars.
Second, our results showed that this Vela-like pulsar is very inefficient in the optical and X-rays, as is the Vela pulsar itself (Fig. 7). In combination with a significant interstellar extinction towards the pulsar, AV ≈ 2, this precluded us from detecting it in our deep observations at a level consistent with the optical efficiency of the Vela pulsar.
We did detect a faint optical source coincident with a relatively bright compact feature of the pulsar X-ray PWN, presumably a wisp, located ~2 from the pulsar (Fig. 3). The source colour V − R ≈ 0.6 is consistent with colours typical for PWNe structures, suggesting that the source is an optical counterpart candidate to the X-ray feature. The poor X-ray count statistics precludes us from constraining the multi-wavelength spectrum of the source. On the basis of current data, background nature of the source cannot be excluded.
Any additional optical studies of the pulsar have to be carried out at longer wavelengths, which are less affected by the interstellar extinction.
Recent progress in the multi-wavelength studies of Vela-like pulsars adds new evidence of their low efficiency in the optical and X-rays. This forms a puzzling minimum in the optical and X-ray efficiency relations vs. pulsar age, while in γ-rays it appears to be absent (Abdo et al. 2010). Future studies will show whether this is a signature of some interesting change in a neutron star magnetosphere and particle acceleration at the 10 kyr age, or just an incomplete sample effect, which disappears when more Vela-like pulsars will be detected in the optical and X-rays.
Note added in proof. After submission of this paper, an independent analysis of the same data set appeared by Razzano et al. (2013). Their conclusion that star 6 cannot be the optical counterpart to the pulsar is consistent with our results. Their pulsar flux upper limits are higher by a factor of 3 to 4 for unknown reasons.
For instrument details see http://www.eso.org/instruments/fors/
Obs. ID 3842, date 2003.10.08, Exp. time 36 ks, PI V. Kaspi.
See e.g. “A User’s Guide to Stellar CCD Photometry with IRAF” by P. Massey and L. Davis, http://iraf.net/irafdocs/
Obtained with the CTIO 4-m telescope as a part of ChaMPlane survey (Grindlay et al. 2005).
GLIMPSE project, PI S. Majewski.
Instrument ATCA, date 13-05-1997, epoch 50581, RA = 10:48:12.6(3), Dec = −58:32:03.75(1) J2000.
Instrument Parkes, date 25-02-1993–29-03-1997, epoch 49043–50536, RA = 10:48:12.2(1), Dec = −58:32:05.8(8) J2000.
The Xspec goodness task simulates data with given response files and model. The fit is good when about 50% of the simulated spectra have a value of C lower than that of the data in question.
See http://irsa.ipac.caltech.edu/applications/DataTag/, DataTag = ADS/IRSA.Gator#2012/0306/095311_11593
Acknowledgments
We are grateful to the anonymous referee for useful comments allowing us to improve the paper. The work was partially supported by the Russian Foundation for Basic Research (grants 11-02-00253 and 11-02-12082), RF Presidential Program (Grant NSh 4035.2012.2), and the Ministry of Education and Science of the Russian Federation (Contract No. 11.G34.31.0001 and Agreement No.8409, 2012).
References
- Abdo, A. A., Ackermann, M., Ajello, M., et al. 2010, ApJS, 187, 460 [NASA ADS] [CrossRef] [Google Scholar]
- Arnaud, K. A. 1996, in Astronomical Data Analysis Software and Systems V, eds. G. H. Jacoby, & J. Barnes, ASP Conf. Ser., 101, 17 [Google Scholar]
- Cash, W. 1979, ApJ, 228, 939 [NASA ADS] [CrossRef] [Google Scholar]
- Danilenko, A., Kirichenko, A., Mennickent, R. E., et al. 2012, A&A, 540, A28 [NASA ADS] [CrossRef] [EDP Sciences] [Google Scholar]
- Fukugita, M., Shimasaku, K., & Ichikawa, T. 1995, PASP, 107, 945 [NASA ADS] [CrossRef] [Google Scholar]
- Gonzalez, M. E., Kaspi, V. M., Pivovaroff, M. J., & Gaensler, B. M. 2006, ApJ, 652, 569 [NASA ADS] [CrossRef] [Google Scholar]
- Grindlay, J. E., Hong, J., Zhao, P., et al. 2005, ApJ, 635, 920 [NASA ADS] [CrossRef] [Google Scholar]
- Hillier, D. J., Davidson, K., Ishibashi, K., & Gull, T. 2001, ApJ, 553, 837 [NASA ADS] [CrossRef] [Google Scholar]
- Johnston, S., Lyne, A. G., Manchester, R. N., et al. 1992, MNRAS, 255, 401 [NASA ADS] [CrossRef] [Google Scholar]
- Keane, E. F., Kramer, M., Lyne, A. G., Stappers, B. W., & McLaughlin, M. A. 2011, MNRAS, 415, 3065 [NASA ADS] [CrossRef] [Google Scholar]
- López-Corredoira, M., Cabrera-Lavers, A., Garzón, F., & Hammersley, P. L. 2002, A&A, 394, 883 [NASA ADS] [CrossRef] [EDP Sciences] [Google Scholar]
- Mignani, R. P., Shearer, A., de Luca, A., et al. 2011, A&A, 533, A101 [NASA ADS] [CrossRef] [EDP Sciences] [Google Scholar]
- Percival, J. W., Biggs, J. D., Dolan, J. F., et al. 1993, ApJ, 407, 276 [NASA ADS] [CrossRef] [Google Scholar]
- Pires, A. M., Motch, C., Turolla, R., et al. 2012, A&A, 544, A17 [NASA ADS] [CrossRef] [EDP Sciences] [Google Scholar]
- Povich, M. S., Smith, N., Majewski, S. R., et al. 2011, ApJS, 194, 14 [NASA ADS] [CrossRef] [Google Scholar]
- Predehl, P., & Schmitt, J. H. M. M. 1995, A&A, 293, 889 [NASA ADS] [Google Scholar]
- Razzano, M., Mignani, R. P., Marelli, M., & de Luca, A. 2013, MNRAS, 428, 3636 [NASA ADS] [CrossRef] [Google Scholar]
- Sandberg, A., & Sollerman, J. 2009, A&A, 504, 525 [NASA ADS] [CrossRef] [EDP Sciences] [Google Scholar]
- Schlegel, D. J., Finkbeiner, D. P., & Davis, M. 1998, ApJ, 500, 525 [NASA ADS] [CrossRef] [Google Scholar]
- Shibanov, Y. A., Koptsevich, A. B., Sollerman, J., & Lundqvist, P. 2003, A&A, 406, 645 [NASA ADS] [CrossRef] [EDP Sciences] [Google Scholar]
- Shibanov, Y. A., Zharikov, S. V., Komarova, V. N., et al. 2006, A&A, 448, 313 [NASA ADS] [CrossRef] [EDP Sciences] [Google Scholar]
- Smith, N. 2006, ApJ, 644, 1151 [NASA ADS] [CrossRef] [Google Scholar]
- Stappers, B. W., Gaensler, B. M., & Johnston, S. 1999, MNRAS, 308, 609 [NASA ADS] [CrossRef] [Google Scholar]
- Stetson, P. B. 1987, PASP, 99, 191 [NASA ADS] [CrossRef] [Google Scholar]
- Stetson, P. B. 2000, PASP, 112, 925 [NASA ADS] [CrossRef] [Google Scholar]
- Thompson, D. J. 2008, Rep. Prog. Phys., 71, 116901 [NASA ADS] [CrossRef] [Google Scholar]
- Townsley, L. K., Broos, P. S., Chu, Y.-H., et al. 2011, ApJS, 194, 15 [NASA ADS] [CrossRef] [Google Scholar]
- Wachter, K., Leach, R., & Kellogg, E. 1979, ApJ, 230, 274 [Google Scholar]
- Wang, N., Manchester, R. N., Pace, R. T., et al. 2000, MNRAS, 317, 843 [NASA ADS] [CrossRef] [Google Scholar]
- Zavlin, V. E., & Pavlov, G. G. 2004, ApJ, 616, 452 [NASA ADS] [CrossRef] [Google Scholar]
- Zharikov, S. V., Shibanov, Y. A., Mennickent, R. E., et al. 2004, A&A, 417, 1017 [NASA ADS] [CrossRef] [EDP Sciences] [Google Scholar]
All Tables
All Figures
|
Fig. 1 Field of PSR J1048–5832 obtained in the V band with the VLT (left), and in Hα with the CTIO (right). The dark horizontal lines in the VLT image are due to a gap between the two FORS2/CCD chips and dithered exposures. The box in the Hα image shows the VLT FOV. The red and black crosses are the positions of J1048 − 5832 and a nearby neutron star RRAT J1047 − 5841. |
| In the text | |
|
Fig. 2 The ~14 × 14 fragment of the VLT V (top-left) and R (top-middle) band optical, and Chandra 0.5–7 keV X-ray (left-bottom) images of the PSR J1048–5832 vicinity. The Chandra image is smoothed with a four-pixel Gaussian kernel. Colour-bars show brightness scales in 1000 counts in the optical and in counts in X-rays. The cross marks the X-ray position of the pulsar. White-dashed and black-dashed ellipses show its 1σ uncertainties in X-rays and two radio observations. Yellow contours in the R-band image are overlaid from the X-ray image to indicate the PWN structure. Optical sources overlapping with the error ellipses and X-ray PWN are labelled by numbers. Top-right: the observed colour–magnitude diagram of PSR J1048–5832 field stars. The stars labelled in the images are highlighted. |
| In the text | |
|
Fig. 3 Non-smoothed Chandra image (top) and star-subtracted VLT image (bottom). Magenta contours are X-ray contours of the PWN from Fig. 2. The cross and dashed ellipse are the position of the pulsar and its 1σ uncertainty. The yellow contour marks a relatively bright X-ray structure of the PWN 2 south-east of the pulsar, presumably a Crab-like wisp. It spatially coincides with the optical source 5, as can also be seen from the spatial brightness profiles extracted from a slice along the PWN major axis (a white-dashed rectangular in both images) presented in the left panels, where vertical dotted lines indicate the X-ray positions of the pulsar and the wisp. Error-bars indicate typical brightness uncertainties. |
| In the text | |
|
Fig. 4 Fragment of the Chandra/ACIS image of the PSR J1048–5832 field, where ellipses mark the apertures used to extract spectra of the pulsar and PWN. |
| In the text | |
|
Fig. 5 AV-distance relation towards PSR J1048–5832. The vertical dashed line corresponds to the DM distance to the pulsar of 2.7 kpc. The hatched region and horizontal solid line show the confidence interval of AV resulting from the uncertainty interval of NH and its best-fit value for the pulsar presented in Table 3. The entire galactic extinction is indicated by the dash-dotted line. |
| In the text | |
|
Fig. 6 Unabsorbed multi-wavelength spectrum of PSR J1048–5832 compiled from data obtained with the Chandra and VLT. The X-ray part with its uncertainties (hatched regions) is extrapolated to the optical. Black triangles are optical flux upper limits. |
| In the text | |
|
Fig. 7 Comparison of X-ray and V-band luminosities and efficiencies for pulsars of different characteristic age τ detected in both spectral domains. Different pulsars are marked by different symbols. PSR J1048–5832 is shown by the red star. The two dependencies of the pulsar efficiencies with age demonstrate an efficiency minimum near the Vela age, and the Vela-like J1048 − 5832 naturally occupies a place near this minimum. |
| In the text | |
Current usage metrics show cumulative count of Article Views (full-text article views including HTML views, PDF and ePub downloads, according to the available data) and Abstracts Views on Vision4Press platform.
Data correspond to usage on the plateform after 2015. The current usage metrics is available 48-96 hours after online publication and is updated daily on week days.
Initial download of the metrics may take a while.