Fig. 24
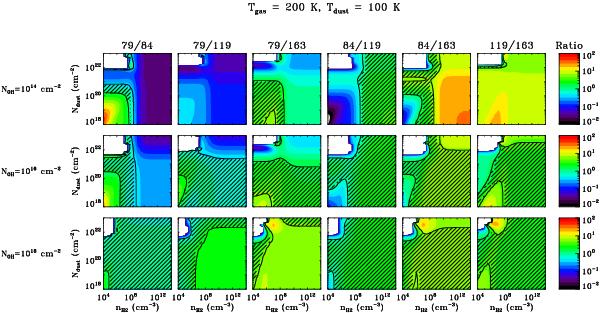
Line flux ratios from slab models with Tgas = 200 K and Tdust = 100 K for the OH lines at 79, 84, 119, and 163 μm for OH column densities of 1014, 1016, and 1018 cm-2, and varying H2 density and dust column density. The shaded area marks the observed values.
Current usage metrics show cumulative count of Article Views (full-text article views including HTML views, PDF and ePub downloads, according to the available data) and Abstracts Views on Vision4Press platform.
Data correspond to usage on the plateform after 2015. The current usage metrics is available 48-96 hours after online publication and is updated daily on week days.
Initial download of the metrics may take a while.