Fig. 1
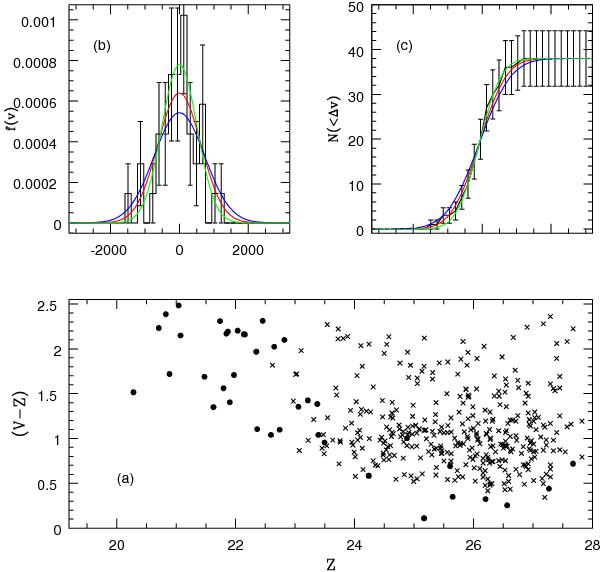
Upper left panel: binned velocity distribution of the spectroscopic members, compared to Gaussians with dispersion obtained through the biweight estimate (red) and considering the jackknife uncertainties (blue and green). All distributions are normalized to 1.0. Upper right panel: cumulative velocity distributions, color code as in the left panel. Lower panel: observed color–magnitude diagram of GN 5 of all spectroscopic (black circles) and photometric (crosses) members of the cluster within 1 Mpc from the center.
Current usage metrics show cumulative count of Article Views (full-text article views including HTML views, PDF and ePub downloads, according to the available data) and Abstracts Views on Vision4Press platform.
Data correspond to usage on the plateform after 2015. The current usage metrics is available 48-96 hours after online publication and is updated daily on week days.
Initial download of the metrics may take a while.