Fig. 1
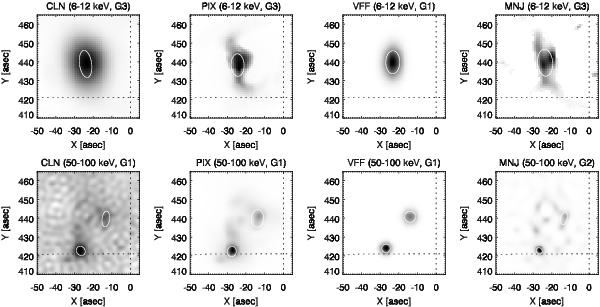
RHESSI images obtained with different reconstruction methods. Shown are images from the peak of the impulsive phase of the M8.2 flare on 2002 Apr. 10. The top row shows the thermal source imaged at 6−12 keV. In the bottom row, the nonthermal footpoints are visible in 50−100 keV images. From left to right, the imaging methods used are CLEAN with natural weighting (CLN), Pixon (PIX), visibility forward fit (VFF), and MEM_NJIT (MNJ). The white ellipses depict the FWHM of 2D Gaussian sources fitted to the images (for CLN, the Gaussians are derived from the CLEAN components; for VFF, they are the forward-fitted sources). The number of the finest grid used for image synthesis is shown on top of each plot.
Current usage metrics show cumulative count of Article Views (full-text article views including HTML views, PDF and ePub downloads, according to the available data) and Abstracts Views on Vision4Press platform.
Data correspond to usage on the plateform after 2015. The current usage metrics is available 48-96 hours after online publication and is updated daily on week days.
Initial download of the metrics may take a while.