Fig. 8
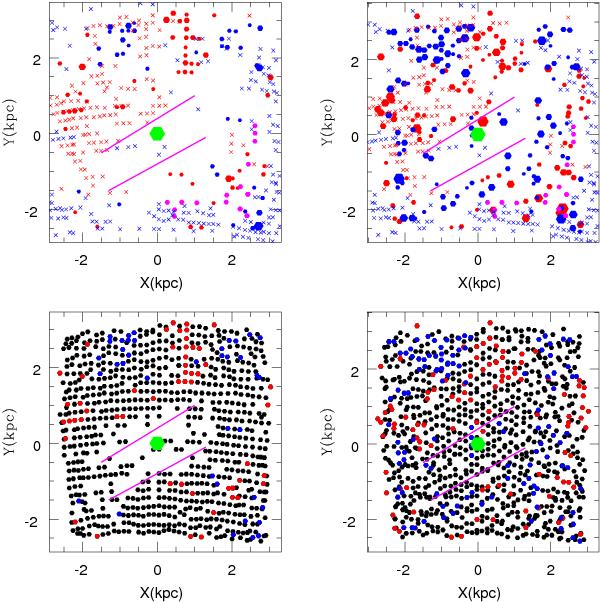
IRSF MCPSC regions which are fitted on the plane and those which are deviated. The lower left and upper left panels are the plots which are obtained from the analysis using method 1. The lower right and upper right panels are the plots obtained from the analysis using method 2. In the lower panels, black dots represent regions on the fitted LMC plane, red dots represent regions behind the fitted plane, and blue dots represent regions in front of the fitted plane. The upper panels show only regions with deviations greater than 1.5 kpc out of the plane, and the size of the dot is proportional to the amplitude of the deviations. The blue crosses are regions in front of the plane, while the red crosses are regions behind the plane; they are identified in the optical study using MCPS data (Subramanian & Subramaniam 2010). Magenta dots are regions which are suggested as warps by Olsen & Salyk (2002). The green hexagon in both the panels represents the optical center of the LMC.
Current usage metrics show cumulative count of Article Views (full-text article views including HTML views, PDF and ePub downloads, according to the available data) and Abstracts Views on Vision4Press platform.
Data correspond to usage on the plateform after 2015. The current usage metrics is available 48-96 hours after online publication and is updated daily on week days.
Initial download of the metrics may take a while.