Free Access
Fig. 3
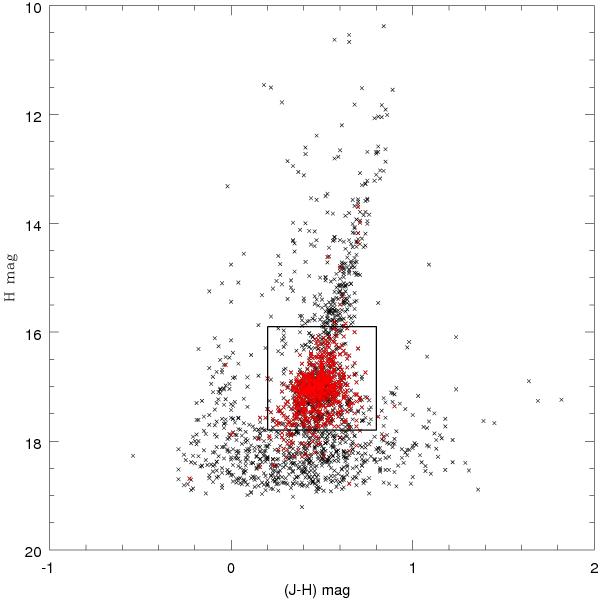
Sample NIR CMD of a sub-region in the LMC with the location of RC stars. The red points are the RC stars identified from the optical CMD of the sub-region. The box within which the RC stars in the IR CMD are distributed is also shown.
Current usage metrics show cumulative count of Article Views (full-text article views including HTML views, PDF and ePub downloads, according to the available data) and Abstracts Views on Vision4Press platform.
Data correspond to usage on the plateform after 2015. The current usage metrics is available 48-96 hours after online publication and is updated daily on week days.
Initial download of the metrics may take a while.