Fig. 14
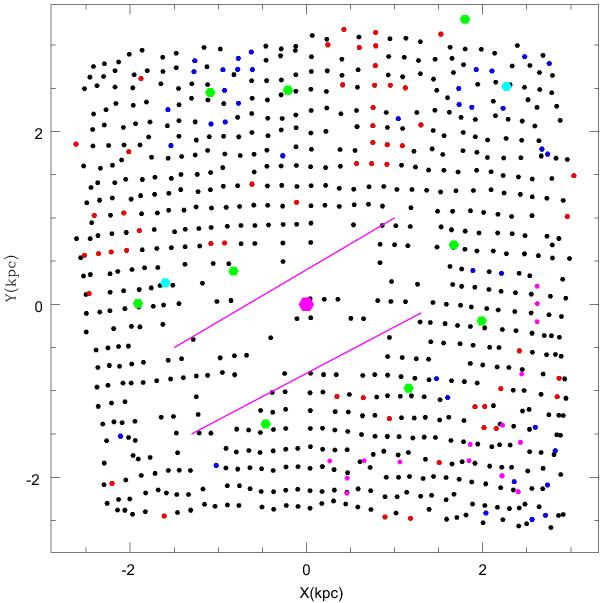
Regions used in the analysis based on method 1 are shown. The black dots are regions on the fitted plane. The blue dots are the regions, in front of the plane, while red dots are behind the plane. The green dots are the locations of super giant shells given by Book et al. (2008). The cyan dots are the location of major star-forming regions 30 Dor and N11. The magenta lines are the approximate location of the bar. The magenta hexagon is the optical center of the LMC.
Current usage metrics show cumulative count of Article Views (full-text article views including HTML views, PDF and ePub downloads, according to the available data) and Abstracts Views on Vision4Press platform.
Data correspond to usage on the plateform after 2015. The current usage metrics is available 48-96 hours after online publication and is updated daily on week days.
Initial download of the metrics may take a while.