Fig. 10
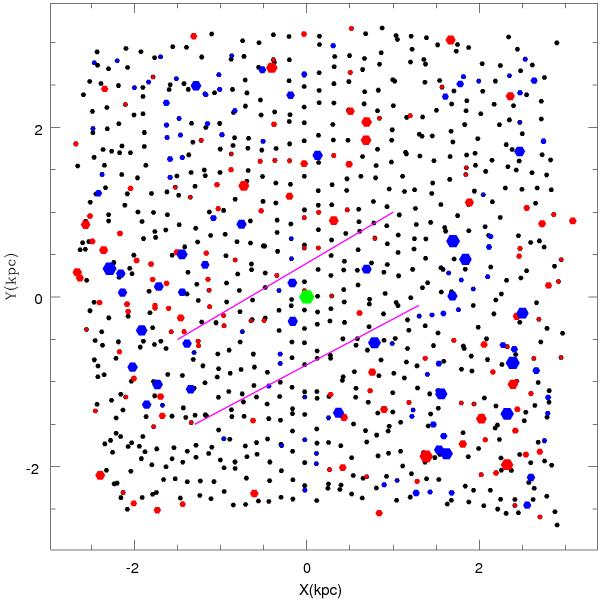
IRSF MCPSC regions which are fitted on the plane and those which are deviated based on the analysis of J band data. The black dots represent regions on the fitted LMC plane, the red dots represent regions behind the fitted plane, and the blue dots represent regions in front of the fitted plane. The size of the blue and red dots is proportional to the amplitude of the deviations.
Current usage metrics show cumulative count of Article Views (full-text article views including HTML views, PDF and ePub downloads, according to the available data) and Abstracts Views on Vision4Press platform.
Data correspond to usage on the plateform after 2015. The current usage metrics is available 48-96 hours after online publication and is updated daily on week days.
Initial download of the metrics may take a while.