Fig. 4
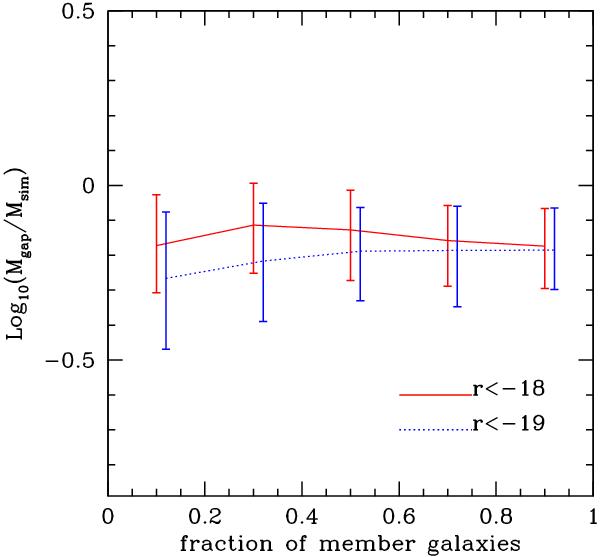
Ratio between the estimated and actual masses of simulated groups with total number of members and velocity dispersions similar to the ones measured for SL2SJ02140-0535, i.e. number of members between 20 and 40, and velocity dispersion between 260 and 460 km s-1. The number of groups in each bin of the plot remains constant. The x-axis corresponds to the fraction of members used for calculating the group mass.
Current usage metrics show cumulative count of Article Views (full-text article views including HTML views, PDF and ePub downloads, according to the available data) and Abstracts Views on Vision4Press platform.
Data correspond to usage on the plateform after 2015. The current usage metrics is available 48-96 hours after online publication and is updated daily on week days.
Initial download of the metrics may take a while.