Fig. 2
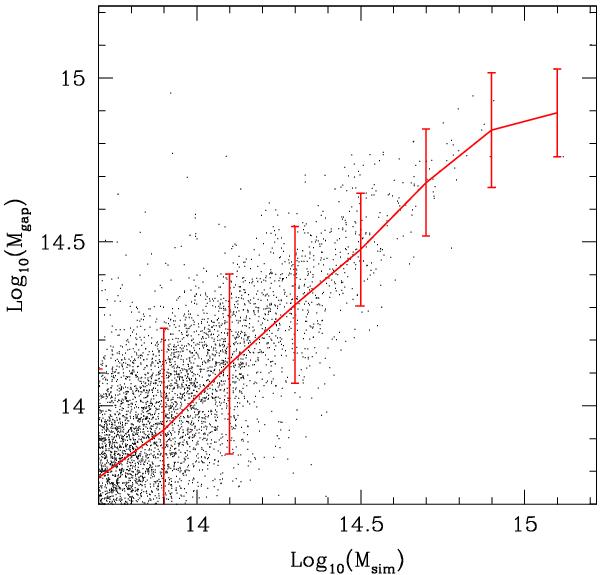
Comparison between estimated gapper mass and underlying halo mass in the simulation. This shows the results when using a 30% of the group members brighter than Mr = −18, randomly selected. Dots represent individual measurements; the solid lines correspond to the median in bins of halo mass, and the errorbars enclose 68 percent of the individual measurements.
Current usage metrics show cumulative count of Article Views (full-text article views including HTML views, PDF and ePub downloads, according to the available data) and Abstracts Views on Vision4Press platform.
Data correspond to usage on the plateform after 2015. The current usage metrics is available 48-96 hours after online publication and is updated daily on week days.
Initial download of the metrics may take a while.