Free Access
Fig. 1
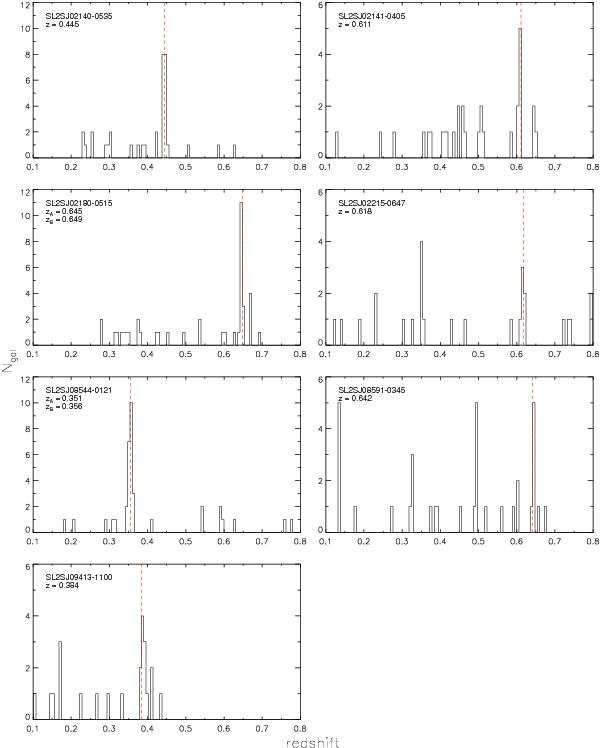
Redshift distribution of galaxies in the group fields. The spectroscopic redshift of isolated groups is denoted by the quantity z, and for double components of bimodal groups, by zA and zB. The vertical dashed line corresponds to the redshift of the most massive component. The bin size of the histogram is δz = 0.006.
Current usage metrics show cumulative count of Article Views (full-text article views including HTML views, PDF and ePub downloads, according to the available data) and Abstracts Views on Vision4Press platform.
Data correspond to usage on the plateform after 2015. The current usage metrics is available 48-96 hours after online publication and is updated daily on week days.
Initial download of the metrics may take a while.