Fig. 11
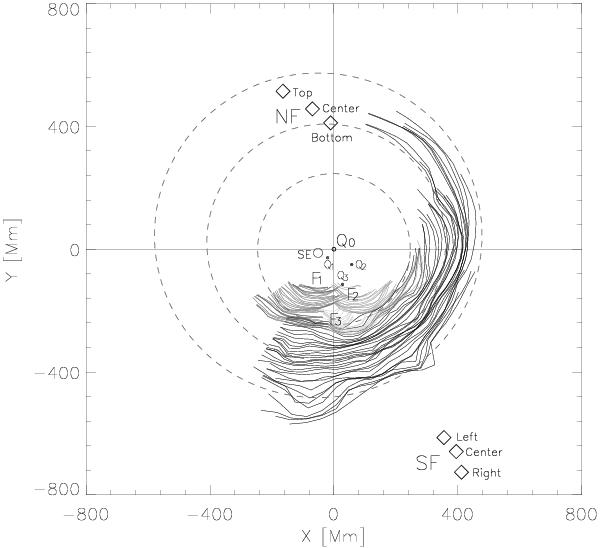
Plane view x − y of chromospheric distances ⟨ d ⟩ centered at Q0. The dashed curves are three circles fitted to the wavefronts. NF and SF indicate the measured points of the filaments. F1, F2, and F3 indicate the earliest wavefronts. SE is the small-scale ejectum initial location. Q1, Q2, and Q3 indicate the earliest wavefront RPs.
Current usage metrics show cumulative count of Article Views (full-text article views including HTML views, PDF and ePub downloads, according to the available data) and Abstracts Views on Vision4Press platform.
Data correspond to usage on the plateform after 2015. The current usage metrics is available 48-96 hours after online publication and is updated daily on week days.
Initial download of the metrics may take a while.