| Issue |
A&A
Volume 551, March 2013
|
|
|---|---|---|
| Article Number | L11 | |
| Number of page(s) | 5 | |
| Section | Letters | |
| DOI | https://doi.org/10.1051/0004-6361/201221001 | |
| Published online | 28 February 2013 | |
LOFAR detections of low-frequency radio recombination lines towards Cassiopeia A
1 Netherlands Institute for Radio Astronomy (ASTRON), Postbus 2, 7990 AA Dwingeloo, The Netherlands
e-mail: This email address is being protected from spambots. You need JavaScript enabled to view it.
2 Kapteyn Astronomical Institute, PO Box 800, 9700 AV Groningen, The Netherlands
3 Leiden Observatory, Leiden University, PO Box 9513, 2300 RA Leiden, The Netherlands
4 STFC Rutherford Appleton Laboratory, Harwell Science and Innovation Campus, Didcot OX11 0QX, UK
5 International Centre for Radio Astronomy Research – Curtin University, GPO Box U1987, Perth, WA 6845, Australia
6 University of Hamburg, Gojenbergsweg 112, 21029 Hamburg, Germany
7 Institute for Astronomy, University of Edinburgh, Royal Observatory of Edinburgh, Blackford Hill, Edinburgh EH9 3HJ, UK
8 Harvard-Smithsonian Center for Astrophysics, 60 Garden Street, Cambridge, MA 02138, USA
9 Research School of Astronomy and Astrophysics, Australian National University, Mt Stromlo Obs., via Cotter Road, A.C.T. 2611 Weston, Australia
10 Department of Astrophysics/IMAPP,Radboud University Nijmegen, PO Box 9010, 6500 GL Nijmegen, The Netherlands
11 Onsala Space Observatory, Dept. of Earth and Space Sciences, Chalmers University of Technology, 43992 Onsala, Sweden
12 Sodankylä Geophysical Observatory, University of Oulu, Tähteläntie 62, 99600 Sodankylä, Finland
13 Astronomical Institute “Anton Pannekoek”, University of Amsterdam, Postbus 94249, 1090 GE Amsterdam, The Netherlands
14 Centre for Radio Astronomy Techniques & Technologies (RATT), Department of Physics and Elelctronics, Rhodes University, PO Box 94, 6140 Grahamstown, South Africa
15 SRON Netherlands Insitute for Space Research, Sorbonnelaan 2, 3584 CA Utrecht, The Netherlands
16 Centre de Recherche Astrophysique de Lyon, Observatoire de Lyon, 9 av. Charles André, 69561 Saint Genis Laval Cedex, France
17 SKA South Africa, 3rd Floor, The Park, Park Road, 7405 Pinelands, South Africa
18 School of Physics and Astronomy, University of Southampton, Southampton, SO17 1BJ, UK
19 Centrum Wiskunde & Informatica, PO Box 94079, 1090 GB, Amsterdam, The Netherlands
20 Laboratoire Lagrange, UMR7293, Université de Nice Sophia-Antipolis, CNRS, Observatoire de la Côte d’Azur, 06300 Nice, France
21 LESIA, UMR CNRS 8109, Observatoire de Paris, 92195 Meudon, France
22 Center for Information Technology (CIT), University of Groningen, The Netherlands
23 Laboratoire de Physique et Chimie de l’Environnement et de l’Espace, LPC2E UMR 7328 CNRS, 45071 Orléans Cedex 02, France
24 Radio Astronomy Lab, UC Berkeley, CA, USA
25 Jodrell Bank Center for Astrophysics, School of Physics and Astronomy, The University of Manchester, Manchester M13 9PL, UK
26 Argelander-Institut für Astronomie, University of Bonn, Auf dem Hügel 71, 53121 Bonn, Germany
27 Astro Space Center of the Lebedev Physical Institute, Profsoyuznaya str. 84/32, 117997 Moscow, Russia
28 Thüringer Landessternwarte, Sternwarte 5, 07778 Tautenburg, Germany
29 Max Planck Institute for Astrophysics, Karl Schwarzschild Str. 1, 85741 Garching, Germany
30 Leibniz-Institut für Astrophysik Potsdam (AIP), An der Sternwarte 16, 14482 Potsdam, Germany
31 National Radio Astronomy Observatory, 520 Edgemont Road, Charlottesville, VA 22903-2475, USA
32 Max-Planck-Institut für Radioastronomie, Auf dem Hügel 69, 53121 Bonn, Germany
33 Astrophysics, University of Oxford, Denys Wilkinson Building, Keble Road, Oxford OX1 3RH, UK
34 Astronomisches Institut der Ruhr-Universität Bochum, Universitaetsstrasse 150, 44780 Bochum, Germany
35 ARC Centre of Excellence for All-sky astrophysics (CAASTRO), Sydney Institute of Astronomy, University of Sydney, Australia
36 Station de Radioastronomie de Nançay, Observatoire de Paris, CNRS/INSU, 18330 Nancay, France
37 CSIRO Australia Telescope National Facility, PO Box 76, NSW 1710 Epping, Australia
38 Department of Physics & Astronomy, The Open University, UK
Received: 24 December 2012
Accepted: 11 February 2013
Abstract
Cassiopeia A was observed using the low-band antennas of the LOw Frequency ARray (LOFAR) with high spectral resolution. This allowed a search for radio recombination lines (RRLs) along the line-of-sight to this source. Five carbon α RRLs were detected in absorption between 40 and 50 MHz with a signal-to-noise ratio of >5 from two independent LOFAR data sets. The derived line velocities (vLSR ~ − 50 km s-1) and integrated optical depths (~13 s-1) of the RRLs in our spectra, extracted over the whole supernova remnant, are consistent within each LOFAR data set and with those previously reported. For the first time, we are able to extract spectra against the brightest hotspot of the remnant at frequencies below 330 MHz. These spectra show significantly higher (15–80 percent) integrated optical depths, indicating that there is small-scale angular structure of the order of ~1 pc in the absorbing gas distribution over the face of the remnant. We also place an upper limit of 3 × 10⁻⁴ on the peak optical depths of hydrogen and helium RRLs. These results demonstrate that LOFAR has the desired spectral stability and sensitivity to study faint recombination lines in the decameter band.
Key words: ISM: clouds / radio lines: ISM / ISM: individual objects: Cassiopeia A
© ESO, 2013
1. Introduction
Radio recombination lines (RRLs) arise from ions recombining with electrons in diffuse, partially ionised gas. At high principal quantum numbers (i.e. n ≳ 200 at frequencies ≲1 GHz), RRLs are an important probe of the temperature and density of the cool (T ≲ 100 K) interstellar medium (e.g., Payne et al. 1989; Konovalenko 1984). RRL measurements have distinct advantages over other tracers of the ionised gas; the extinction caused by dust and the contamination from other sources are negligible. However, there have been only a limited number of surveys that have studied RRLs from carbon at low radio frequencies (≲330 MHz; e.g. Erickson et al. 1995; Kantharia & Anantharamaiah 2001; Roshi et al. 2002). Also, the low angular resolution of these early surveys, from several degrees to around 6 arcmin, did not allow the location of the line-emitting gas to be determined, and also limited their capability to detect faint RRL sources due to beam dilution effects.
The LOw Frequency ARray (LOFAR; Stappers et al. 2011; van Haarlem et al. 2013) is a new-generation radio telescope, which given its unique design, can be used to make sensitive surveys for RRLs with high spectral and spatial resolution. LOFAR comprises thousands of antennas arranged in (currently) 41 stations spread across the Netherlands and other European countries. By design, LOFAR provides excellent baseline coverage, particularly in the inner 3 km core-region, where over half of the collecting area is contained. The low-band antennas (LBAs) of LOFAR, although optimised for frequencies above 30 MHz, cover the frequency range from 10 to 90 MHz. The high-band antennas (HBAs) cover the frequency range from 110 to 250 MHz. This large observable frequency window makes LOFAR an ideal instrument for carrying out studies of the ISM with low-frequency RRLs.
In this Letter, we present the first spectral line measurements made using the LBA system of LOFAR. We target carbon RRLs in absorption towards the supernova remnant Cassiopeia A (Cas A), which is one of the brightest continuum sources in the sky and has a sightline that is already known to display strong carbon RRLs in low frequency spectra (see Stepkin et al. 2007, and references therein). In Sect. 2, we present our LOFAR commissioning observations and data analysis steps. Our carbon RRL detections are presented in Sect. 3, and we discuss these detections and present our conclusions in Sect. 4.
Summary of the LOFAR data sets used for our analysis.
2. Observations and data reduction
The data sets for our RRL study are taken from two LOFAR commissioning observations of Cas A in the 30 to 90 MHz (LBA) band. The first data set (Data-1) was taken on 2011 May 4 using the 16 core stations and 7 remote stations that were constructed at the time, giving baselines up to about 24 km. These data were taken with 1-s visibility integrations and 244 separate frequency subbands, each with a bandwidth of 195 kHz and 256 spectral channels. The second data set (Data-2) was observed on 2011 October 15 using 24 core stations and 8 remote stations, and had a maximum baseline length of about 83 km. Data-2 was taken in a multi-beam mode that is used for standard continuum observations, with one beam on Cas A and a second beam on Cygnus A. This resulted in only half of the available bandwidth being used for the observation of Cas A. Also, a coarser spectral resolution of 64 spectral channels within each of the 122 subbands of 195 kHz bandwidth was used. The visibility integration time was again 1 s. After the first step of interference removal using the AOFlagger routine (Offringa et al. 2010), the data were averaged in time and/or frequency as required.
In total, we produced 3 data sets for our work. First, to make a continuum image of Cas A, we produced an intermediate data set from Data-1 that had a coarse spectral resolution of ~50 kHz channel-1 in order to speed up the calibration process later. Next, we created two RRL data sets. For Data-1, we included only those baselines between the separate core-stations (<2.6 km) and retained the full spectral resolution of 762 Hz channel-1. Data-2 was processed to retain a spectral resolution of 3.1 kHz channel-1 and to also include longer baselines (<24 km) so that spectra could be extracted from individual regions across the supernova remnant. For these two RRL data sets, we decided to concentrate our search to those frequencies between 40 to 50 MHz. This was because the RRL absorption was expected to be stronger at the lower end of the LBA spectrum due to the steep broadband spectral energy distribution of Cas A. The lower frequency end of the search window was chosen because the level of terrestrial interference increases below 40 MHz (Offringa et al. 2013). The resulting time and frequency resolution for each data set after these preprocessing steps are summarised in Table 1.
We initially calibrated our continuum data using the BlackBoard Self-calibration package (bbs; Pandey et al. 2009), with a relatively simple initial model, containing about a dozen point sources and one shapelet model. We then used the sagecal package (Kazemi et al. 2011) to solve for the direction-dependent amplitude and phase variations in the data and to update the shapelet model for Cas A. To mitigate artefacts due to Cygnus A, present about 30 degrees away, we simultaneously solved for direction-dependent gains towards Cas A and Cygnus A, and subtracted the latter in the visibility data using a shapelet model. We then imaged the source using the casa imager1 and constructed a composite sky model from the image by fitting for point and shapelet sources (see e.g., Yatawatta et al. 2011). We iterated over this scheme (bbs calibration → imaging → skymodel → calibration) to obtain high-resolution continuum images and improved source models. In Fig. 1, we present a 40 arcsec resolution continuum image of the supernova remnant at 52 MHz (single subband). Given the excellent spatial resolution of LOFAR, a number of complex features are clearly resolved (c.f., Kantharia et al. 1998; Lane et al. 2005). Further details of the calibration strategy and a full discussion of the continuum imaging of Cas A, and the wider surrounding field, will be presented in a companion paper (Yatawatta et al., in prep.).
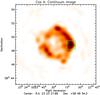 |
Fig. 1 LOFAR image of Cas A at 52 MHz (single subband of 195 kHz bandwidth). The image was made using Briggs weighting (robust = 0) and was restored using a beam size of 40 arcsec. The hotspot region used to extract spectra from Data-2 is marked with the green square. |
To detect RRLs along the line-of-sight to Cas A, we calibrated the RRL visibility data sets (see Table 1) with bbs using our final sky model that was obtained from our analysis of the continuum data. Multi-channel maps were constructed using the clean algorithm within casa, and image cubes from the individual subbands were analysed separately. Spectra were then extracted over the whole remnant and over the brightest hotspot (see Fig. 1). The resultant spectra displayed a few artefacts, such as breaks at the subband boundaries and bad channels on the edge of each subband; typically around 5 per cent of the channels per subband. These bad channels were removed during further analysis. Doppler correction terms are currently not incorporated in the LOFAR imaging pipeline, hence the spectra were Doppler corrected after extraction. This leads to an uncertainty of ≲1 km s-1 in the determination of the central velocities and line widths. This error is negligible compared to the velocity resolution of our data.
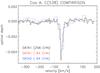 |
Fig. 2 Representative detection of a carbon α RRL towards Cas A with LOFAR. We show spectra of the RRL C538α that was measured using Data-1 (black solid) and Data-2 (blue dashed). For comparison, we have also smoothed the Data-1 spectrum to the same spectral resolution as Data-2 (red dashed). These spectra demonstrate the spectral stability of the LOFAR system for making spectral line measurements. |
3. Results
The subset of Data-1 that was used for the RRL analysis only contained the short baselines between the core-stations (≲2.6 km), for which Cas A is practically unresolved. Therefore, spectra were obtained over the whole remnant with a spectral resolution of 762 Hz channel-1, which is equivalent to a velocity resolution of ~5 km s-1 at 45 MHz. We report the detection (at >16σ level) of four carbon α RRLs (C518α, C538α, C541α and C543α) towards Cas A in Data-1 between 40 to 50 MHz. In Fig. 2, we present a representative spectrum of a RRL detection, with respect to the local standard of rest (LSR). For each detected RRL, we measured the line widths and integrated optical depths ( ) by fitting Gaussian components to the spectra, the results of which are presented in Table 2. Only single Gaussian-line profiles were used because our spectra do not currently have a sufficient signal-to-noise ratio to reliably measure multiple components in the line structure. All of the detected RRLs have measured velocities at vLSR ~ −48 ± 1 km s-1, consistent with the velocity of the gas in the Perseus arm, the likely absorber along the line-of-sight to Cas A (Konovalenko 1984; Ershov et al. 1984, 1987; Payne et al. 1989, 1994). These RRL detections from Data-1 represent the first spectral-line measurements made with LOFAR.
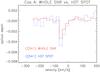 |
Fig. 3 Spectrum of the RRL C541α measured over the whole remnant (red) and only over the hotspot region (blue) using Data-2. These data demonstrate that the integrated optical depth over the hotspot region is higher than across the remnant, showing that there is likely structure in the absorbing gas on scales of ~1 pc. |
Derived line parameters for the RRLs measured from Data-1 and Data-2.
The main goal of our study is to investigate whether there is any structure in the absorbing gas by detecting a variation in the integrated optical depths of the RRLs over the extent of the remnant. For this, LOFAR’s unparalleled spatial resolution at frequencies below 100 MHz is required. We extracted spectra using Data-2 in two ways; one towards the compact hotspot component and the other over the entire area of the remnant. We detected five carbon α RRLs (at >5σ level) in both our integrated spectra and the spectra extracted over the brightest hotspot component in the remnant. As these lines were only marginally resolved, we estimated their integrated optical depths by summing the measured optical depth over two channels. The results of these measurements are also given in Table 2. In Fig. 3, we show a representative detection of a carbon α RRL (C541α) against the whole remnant and the hotspot. Earlier studies (see e.g., Payne et al. 1989) reported two components at vLSR ~ −50 and ~−40 km s-1, where the former dominates by a factor 2−3. Due to insufficient signal-to-noise ratio we can not currently separate these components, but the observed line-profile asymmetry in our spectra (see Figs. 2 and 3) is consistent with two components.
We also carried out a search for hydrogen and helium RRLs in the individual subbands of our data sets (without any folding in frequency), but found no significant detection. The spectral noise per channel in our most sensitive data set (Data-1) is ~10-4, so we derive an upper limit (3σ) on the peak optical depth of hydrogen and helium RRLs of 3 × 10⁻⁴, or an equivalent integrated optical depth of 0.9 s-1. Following Shaver (1976), we derive an upper limit of 4 × 10-18 s-1 for the interstellar ionisation rate of hydrogen. Our limit is significantly lower than the previously reported values despite the uncertainties in determining various parameters (see e.g., Payne et al. 1994; Gordon & Sorochenko 2009, Sect. 3.3.6), indicating that cosmic rays can not ionise the intercloud gas to the observed degree.
4. Discussion and conclusions
In total, we have detected five carbon α RRLs towards Cas A from our two LOFAR commissioning data sets. In Fig. 4, we plot the integrated optical depths of these RRLs as measured from each LOFAR data set, and also the integrated optical depths for those RRLs that were previously measured towards Cas A with other telescopes (Ershov et al. 1984, 1987; Payne et al. 1989, 1994), as a function of the principal quantum number. We see that the integrated optical depths, as measured over the whole remnant, are consistent between Data-1 and Data-2 for the four RRLs that are common to both data sets. This demonstrates the spectral stability of our LOFAR commissioning data sets. We also find consistency for the RRL C538α, where we have both LOFAR and previously reported measurements in the literature. Although we currently do not have measurements for the other two previously detected RRLs (C502α and C552α), the reported integrated optical depths of these lines are generally consistent with the RRLs that we have detected in the LOFAR data sets.
Multiple carbon RRLs are usually modelled together in order to derive the physical conditions of the line-absorbing gas, since the electron levels are in non-local thermal equilibrium (non-LTE) conditions. Crucial inputs to these models include accurate line width measurements from high-spectral resolution data. Kantharia et al. (1998) show that previous low-frequency measurements of carbon α RRLs can be modelled as originating in cold (Te ~ 75 K), low density (ne ~ 0.02 cm-3) clouds that are located approximately 115 pc away from Cas A. Higher density models (Te ~ 75 K, ne ~ 0.1 cm-3) are also able to fit the data, but these are less appealing due to their thermal pressures being very high. Although our current RRL detections are consistent with these models, given the agreement with the previous measurements, future observations of RRLs over the whole LOFAR observing window, and hence over a large and densely sampled range of principal quantum number, will differentiate between these competing models. The results from such a detailed analysis using new observations will be reported in a forthcoming paper (Oonk et al., in prep).
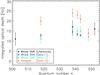 |
Fig. 4 Integrated optical depths as a function of the principal quantum number for both data sets (Data-1 and Data-2) and for those previously reported in the literature (Ershov et al. 1984, 1987; Payne et al. 1989, 1994). We find good agreement between the measurements made over the whole remnant from the two LOFAR data sets and with those in the literature. We also find that the integrated optical depths of the RRLs are higher over the bright hotspot component with respect to the measurements over the whole remnant, implying that there is likely small-scale structure in the absorbing gas distribution. |
We also find from Fig. 4 that the integrated optical depths towards the hotspot are larger by up to almost a factor of 2, when compared to the integrated optical depths measured over the whole remnant. This shows that there is small-scale angular structures and/or the geometry of the RRL-absorbing gas is such that there is varying levels of absorption over the face of the remnant (see, e.g. Kantharia et al. 1998). This corresponds to structure in the RRL-absorbing gas of the order of ~1 pc. To model this structure, we plan to make new LOFAR observations with a higher spectral and spatial resolution in the future.
Our results from the commissioning data sets demonstrate that LOFAR can be used to carry out spectral line observations at low radio frequencies. For the case of RRL studies, LOFAR will be an important tool in the future for two main reasons. First, given the up to arcsecond-scale resolution that can be obtained with LOFAR, beam dilution effects will not affect our detection sensitivity. Second, due to the large observable frequency range of LOFAR, from 10 to 250 MHz, hundreds of low-frequency RRLs will be detectable for the first time. Furthermore, due to the large bandwidth that can be observed during each observation, many of these RRLs will be detected in a single observation, making wide-field surveys for RRLs possible for the first time. The results reported here form part of the LOFAR Surveys key science project. In the near future, we plan to observe various bright sources (Galactic and extragalactic) with compact morphologies in the LOFAR LBA and HBA bands. Later studies will focus on RRLs towards regions of diffuse emission in the Galactic plane and fields with complex emission features.
Acknowledgments
LOFAR, designed and constructed by ASTRON, has facilities in several countries, that are owned by various parties (each with their own funding sources), and that are collectively operated by the International LOFAR Telescope (ILT) foundation under a joint scientific policy. A.A. would like to thank M. I. R. Alves for discussions and comments on an early version of this manuscript. A.A. acknowledges support from IUCAA, Pune, during the preparation of this manuscript. R.J.v.W. acknowledges support from NASA through the Einstein Postdoctoral grant number PF2-130104 awarded by the Chandra X-ray Center, which is operated by the Smithsonian Astrophysical Observatory for NASA under contract NAS8-03060. C.F. acknowledges financial support by the “Agence Nationale de la Recherche” through grant ANR-09-JCJC-0001-01.
References
- Erickson, W. C., McConnell, D., & Anantharamaiah, K. R. 1995, ApJ, 454, 125 [NASA ADS] [CrossRef] [Google Scholar]
- Ershov, A. A., Ilyashov, Y. P., Lekht, E. E., et al. 1984, SvA, 10, L348 [NASA ADS] [Google Scholar]
- Ershov, A. A., Lekht, E. E., Smirnov, G. T., & Sorochenko, R. L. 1987, SvA, 13, L8 [NASA ADS] [Google Scholar]
- Gordon, M. A., & Sorochenko, R. L. 2009, Radio Recombination Lines: Their Physics and Astronomical Applications, Springer [Google Scholar]
- Kantharia, N. G., & Anantharamaiah, K. R. 2001, JA&A, 22, 51 [Google Scholar]
- Kantharia, N. G., Anantharamaiah, K. R., & Payne, H. E. 1998, ApJ, 506, 758 [NASA ADS] [CrossRef] [Google Scholar]
- Kazemi, S., Yatawatta, S., Zaroubi, S., et al. 2011, MNRAS, 414, 1656 [NASA ADS] [CrossRef] [Google Scholar]
- Konovalenko, A. A. 1984, SvA, 10, L384 [Google Scholar]
- Lane, W. M., Cohen, A. S, Kassim, N. E., & Lazio, T. J. W. 2005, in From Clark Lake to the Long Wavelength Array: Bill Erickson’s Radio Science, eds. N. Kassim, M. Perez, M. Junor, & P. Henning, ASP Conf. Ser., 345, 203 [Google Scholar]
- Offringa, A. R., de Bruyn, A. G., Biehl, M., et al. 2010, MNRAS, 405, 155 [NASA ADS] [Google Scholar]
- Offringa, A. R., de Bruyn, A. G., Zaroubi, S., et al. 2013, A&A, 549, A11 [NASA ADS] [CrossRef] [EDP Sciences] [Google Scholar]
- Pandey, V. N., van Zwieten, J. E., de Bruyn, A. G., & Nijboer, R. 2009, eds. D. J. Saikia, D. A. Green, Y. Gupta, T. Venturi, The Low-Frequency Radio Universe, ASP Conf. Ser., 407, 384 [Google Scholar]
- Payne, H. E., Anantharamaiah, K. R., & Erickson, W. C. 1989, ApJ, 341, 890 [NASA ADS] [CrossRef] [Google Scholar]
- Payne, H. E., Anantharamaiah, K. R., & Erickson, W. C. 1994, ApJ, 430, 690 [NASA ADS] [CrossRef] [Google Scholar]
- Roshi, D. A., Kantharia, N. G., & Anantharamaiah, K. R. 2002, A&A, 391, 1097 [NASA ADS] [CrossRef] [EDP Sciences] [Google Scholar]
- Shaver, P. A. 1976, A&A, 49, 149 [NASA ADS] [Google Scholar]
- Stepkin, S. V., Konovalenko, A. A., Kantharia, N. G., & Udaya Shankar, N. 2007, MNRAS, 374, 852 [NASA ADS] [CrossRef] [Google Scholar]
- Stappers, B. W., Hessels, J. W. T., Alexov, A., et al. 2011, A&A, 530, A80 [NASA ADS] [CrossRef] [EDP Sciences] [Google Scholar]
- van Haarlem, M. P., Wise, M. W., Gunst A., et al. 2013, A&A, submitted [Google Scholar]
- Yatawatta, S. 2011, Shapelets and related techniques in radio astronomical imaging, in Proc. URSI General Assembly, Istanbul, Turkey [Google Scholar]
All Tables
All Figures
|
Fig. 1 LOFAR image of Cas A at 52 MHz (single subband of 195 kHz bandwidth). The image was made using Briggs weighting (robust = 0) and was restored using a beam size of 40 arcsec. The hotspot region used to extract spectra from Data-2 is marked with the green square. |
| In the text | |
|
Fig. 2 Representative detection of a carbon α RRL towards Cas A with LOFAR. We show spectra of the RRL C538α that was measured using Data-1 (black solid) and Data-2 (blue dashed). For comparison, we have also smoothed the Data-1 spectrum to the same spectral resolution as Data-2 (red dashed). These spectra demonstrate the spectral stability of the LOFAR system for making spectral line measurements. |
| In the text | |
|
Fig. 3 Spectrum of the RRL C541α measured over the whole remnant (red) and only over the hotspot region (blue) using Data-2. These data demonstrate that the integrated optical depth over the hotspot region is higher than across the remnant, showing that there is likely structure in the absorbing gas on scales of ~1 pc. |
| In the text | |
|
Fig. 4 Integrated optical depths as a function of the principal quantum number for both data sets (Data-1 and Data-2) and for those previously reported in the literature (Ershov et al. 1984, 1987; Payne et al. 1989, 1994). We find good agreement between the measurements made over the whole remnant from the two LOFAR data sets and with those in the literature. We also find that the integrated optical depths of the RRLs are higher over the bright hotspot component with respect to the measurements over the whole remnant, implying that there is likely small-scale structure in the absorbing gas distribution. |
| In the text | |
Current usage metrics show cumulative count of Article Views (full-text article views including HTML views, PDF and ePub downloads, according to the available data) and Abstracts Views on Vision4Press platform.
Data correspond to usage on the plateform after 2015. The current usage metrics is available 48-96 hours after online publication and is updated daily on week days.
Initial download of the metrics may take a while.