Fig. 2
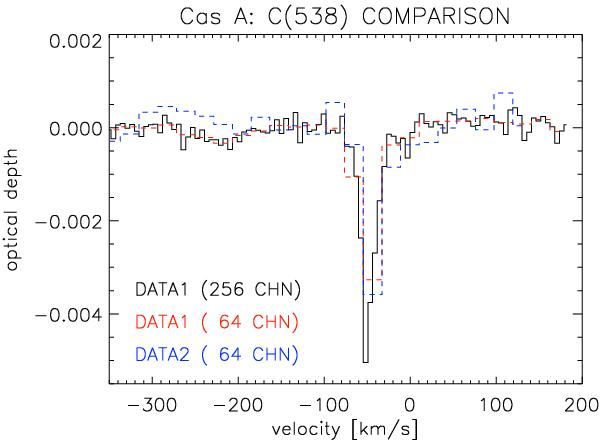
Representative detection of a carbon α RRL towards Cas A with LOFAR. We show spectra of the RRL C538α that was measured using Data-1 (black solid) and Data-2 (blue dashed). For comparison, we have also smoothed the Data-1 spectrum to the same spectral resolution as Data-2 (red dashed). These spectra demonstrate the spectral stability of the LOFAR system for making spectral line measurements.
Current usage metrics show cumulative count of Article Views (full-text article views including HTML views, PDF and ePub downloads, according to the available data) and Abstracts Views on Vision4Press platform.
Data correspond to usage on the plateform after 2015. The current usage metrics is available 48-96 hours after online publication and is updated daily on week days.
Initial download of the metrics may take a while.