Fig. 15
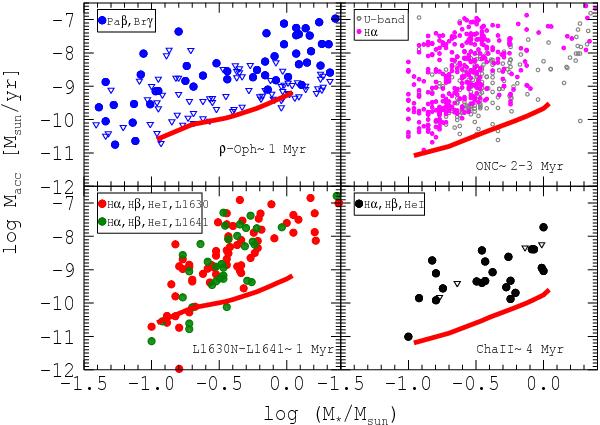
log Ṁacc as a function of log M∗ for Class II objects located in different star forming regions. Data for ρ Oph are from Natta et al. (2006), corrected for new distance measurements by Rigliaco et al. (2011); ONC points are from Manara et al. (2012), data for L1630N and L1641 are from Fang et al. (2009), and those for ChaII from Biazzo et al. (2012). Ṁacc values obtained with indirect methods are shown with colored, filled points, while measurements based on the direct U-band excess method are shown with gray empty points as a reference. Downwards triangles refer to upper limits. The thick red solid line is the lower limit to the measurements of Ṁacc set by chromospheric activity in the line emission. We use the values for the correct isochrone according to the mean value of the age for each region, as reported on the plot.
Current usage metrics show cumulative count of Article Views (full-text article views including HTML views, PDF and ePub downloads, according to the available data) and Abstracts Views on Vision4Press platform.
Data correspond to usage on the plateform after 2015. The current usage metrics is available 48-96 hours after online publication and is updated daily on week days.
Initial download of the metrics may take a while.