Fig. 3
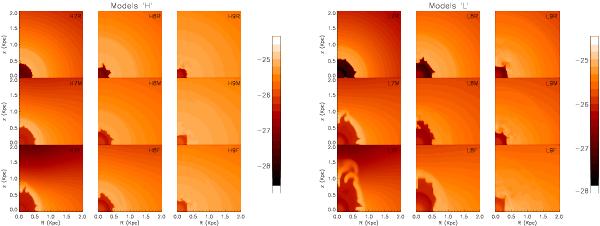
Gas density distribution for the 18 reference models (see Table 2) after 100 Myr of evolution. The nine panels on the left represent the models with high initial gas fraction (models “H”); the nine on the right are the corresponding models with low initial fraction of gas (models “L”). For each sequence of nine panels, the first column represents models with 107 M⊙ of initial baryonic mass, the middle column shows the gas distribution for models with mass 108M⊙, and the right-hand column displays the models with 109M⊙. The top rows of models are characterized by a roundish initial distribution (models “R”, with b/a = 5). The middle rows show models with b/a = 1 (models “M”), and the bottom rows are characterized by b/a = 0.2 (flat models or “F”). In the top-right corner of each panel, the model designation is also indicated. For each set of nine models, the left-hand strip shows the (logarithmic) density scale (in g cm-3).
Current usage metrics show cumulative count of Article Views (full-text article views including HTML views, PDF and ePub downloads, according to the available data) and Abstracts Views on Vision4Press platform.
Data correspond to usage on the plateform after 2015. The current usage metrics is available 48-96 hours after online publication and is updated daily on week days.
Initial download of the metrics may take a while.