Fig. 4
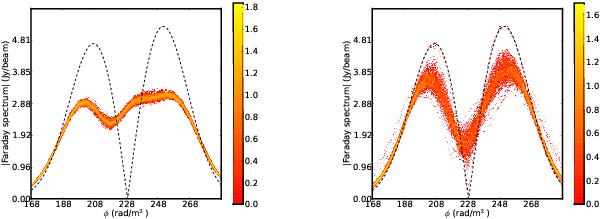
Modulus of the Faraday spectra of two point sources having similar fluxes and the same phase and that are separated by 1 × FWHM (40 rad/m2). The dashed line shows the sky model after convolution with the idealized PSF. The a) RMCLEAN and b) ML reconstructions from 500 trials are plotted in red/yellow. The color scale indicates the log of the number of reconstructions that pass through each location on the figure.
Current usage metrics show cumulative count of Article Views (full-text article views including HTML views, PDF and ePub downloads, according to the available data) and Abstracts Views on Vision4Press platform.
Data correspond to usage on the plateform after 2015. The current usage metrics is available 48-96 hours after online publication and is updated daily on week days.
Initial download of the metrics may take a while.