Fig. 5
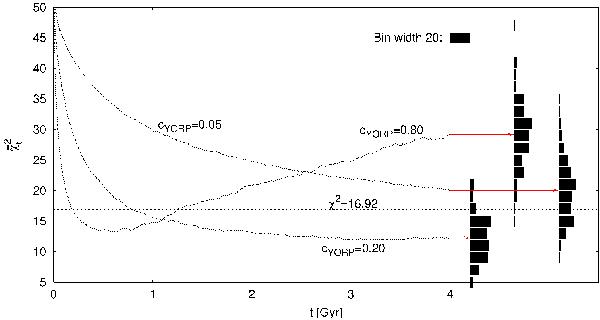
Temporal evolution of the χ2 that corresponds to the difference between the simulated latitude distributions, averaged over all 100 runs, and the debiased observed latitude distribution (i.e.,  ) for three different values of parameter cYORP = 0.05, 0.20, and 0.80 (we performed a chi-square test). Vertical histograms on the righthand side represent the distributions of
  at time t = 4 Gy for all 100 runs. Dotted line: the statistically significant probability value of 5%, i.e. χ2 = 16.92.
Current usage metrics show cumulative count of Article Views (full-text article views including HTML views, PDF and ePub downloads, according to the available data) and Abstracts Views on Vision4Press platform.
Data correspond to usage on the plateform after 2015. The current usage metrics is available 48-96 hours after online publication and is updated daily on week days.
Initial download of the metrics may take a while.