| Issue |
A&A
Volume 551, March 2013
|
|
|---|---|---|
| Article Number | L2 | |
| Number of page(s) | 4 | |
| Section | Letters | |
| DOI | https://doi.org/10.1051/0004-6361/201220677 | |
| Published online | 11 February 2013 | |
INTEGRAL observations of Scorpius X-1: evidence for Comptonization up to 200 keV
Instituto Nacional de Pesquisas Espaciais – INPE Avenida dos Astronautas
1758, 12227-010
São José dos Campos-SP,
Brazil
e-mail: This email address is being protected from spambots. You need JavaScript enabled to view it.
; This email address is being protected from spambots. You need JavaScript enabled to view it.
;
This email address is being protected from spambots. You need JavaScript enabled to view it.
Received: 31 October 2012
Accepted: 22 January 2013
Abstract
We have analyzed a long-term database for Sco X-1 obtained with the telescope IBIS onboard the INTEGRAL satellite in order to study the hard X-ray behavior of Sco X-1 from 20 up to 200 keV. Besides the data used for producing of the INTEGRAL catalog of sources, this is the longest (412 ks) database of IBIS on Sco X-1 up to date. The production of hard X-ray tails in low-mass X-ray binaries is still a matter of debate. Since most of the fits to the high-energy part of the spectra are done with powerlaw models, the physical mechanism for the hard X-ray tail production is unclear. The purpose of this study is to better constrain those possible mechanisms. Our main result shows a strong correlation between the fluxes in the thermal and nonthermal part of Sco X-1 spectra. We, thus, suggest that comptonization of lower energy photons is the mechanism for producing hard X-ray tails in Sco X-1.
Key words: radiation mechanisms: non-thermal / radiation mechanisms: thermal / techniques: image processing / stars: neutron / X-rays: binaries
© ESO, 2013
1. Introduction
INTEGRAL (Winkler et al. 2003) has played a key role in the observations of cosmic X- and γ-ray sources over the past decade. Our study here is a long time-span (~7 years) observation of Sco X-1 (Giacconi et al. 1962). INTEGRAL has the maximum sensitivity for observing Sco X-1 in energies above ~30 keV. Our database was chosen to maximize the sensitivity in our timespan, and it is the longest sample of IBIS/INTEGRAL observations of Sco X-1, besides the 4th INTEGRAL catalog (Bird et al. 2010). Such a homogeneous database has been important for reducing any systematic error due to (e.g.) different flux normalization factors when comparing data from two different instruments.
Sco X-1 is a Z source. The Z sources are low-mass X-ray binaries (LMXBs) fed by accretion onto a neutron star with a low magnetic field (see, e.g, van der Klis 2006). In these systems, an accretion disk is always present, making the Zs persistent sources at the hard X-ray domain (E ≳ 20 keV) up to 40 keV. The spectra of the Zs can be divided into two distinct components: a thermal one, which dominates the emission up to ~40–50 keV, and a nonthermal, highly variable component, which dominates the spectrum at higher energies. The origin of this highly variable component above ~50 keV is still a matter of debate. Hard X-ray spectra of Z sources have already been extensively reported (e.g., Di Salvo et al. 2000, 2001; D’Amico et al. 2001a,c; Iaria et al. 2004; Lavagetto et al. 2004). Sco X-1 plays a key role in understanding these sources, and it was observed well with INTEGRAL (e.g., Di Salvo et al. 2006; Paizis et al. 2006).
INTEGRAL/IBIS/ISGRI observations of Sco X-1.
In this work, based on a long-term sample of Sco X-1 INTEGRAL observations, we show evidence of the comptonization of (softer) photons up to energies ~200 keV. This is one of the few proofs to date of comptonization at E ≳ 50 keV for Sco X-1.
2. Data selection and analysis
The data presented here were collected by the IBIS (Imager on Board the Integral Satellite) telescope (Ubertini et al. 2003) onboard INTEGRAL. It is noteworthy that the JEM-X (Joint European Monitor for X-rays, Lund et al. 2003) count rate is saturated (in almost every practical situation) by Sco X-1. In this way, not having coverage in the low-energy X-ray band of JEM-X, we lost the ability to track Sco X-1 movement along the Z diagram. Such a movement might be driven by the mass accretion rate (e.g. van der Klis et al. 1996). Following the recommendations of the IBIS cookbook, we adopted a 2% systematic error in the IBIS data. This work made use of the version 9.0 of the INTEGRAL/OSA software (e.g., Goldwurm et al. 2003). We took into account, as stressed by IBIS cookbook, the need to extract the spectra of all the sources in the field of view (FOV) simultaneously to avoid any possible sources of errors. Only sources with a signal-to-noise ratio (S/N) greater than ~6 in the FOV needed to be included for the (time-consuming) spectrum extraction. Taking a conservative approach and considering the relative emptiness of the FOV around Sco X-1, we included all the sources with S/N > 2 for the extraction process.
Data were selected based on two primary goals: (1) select the longest observations to maximize IBIS sensitivity; and (2) select (public) observations from 2003 to 2010, creating a long-term database. Our spectral analysis in XSPEC clearly indicates the need for a two-component model. For the first component (referred to here as the thermal component), we used the comptt model in XSPEC. It may sound unusual to use a model that is based on the comptonization of (seed) blackbody Wien’s photons (Titarchuk 1994) and to call it thermal. We just want to emphasize that this part of the Sco X-1 spectra can be adjusted by thermal models and that the comptt uses a thermal seed for photons.
Actually, fits with a simple blackbody also provide adequate fits to the thermal part of our spectra (20–50 keV). In our database, nevertheless, there is a subset that was analyzed (Di Salvo et al. 2006) using the comptt model. In such a way, to maintain uniformity within our study and to make comparisons with other observations, we decided to use the comptt model. This thermal component of the spectrum extends to energies up to ~40–50 keV. The need for including of a second component in the spectrum can be easily verified by (1) the residuals of the fit using only the thermal part and by (2) the significant S/N of the channels from ~50–200 keV.
For this second component, a simple pegpw model in XSPEC adjusts the spectra very well. It is interesting, however, to note that this second part of the spectrum can also be fitted as a second comptonization in the spectrum. Accordingly, we performed the fits for the spectra in our database with two models, (i) comptt+pegpw; and (ii) comptt+comptt, both of them providing adequate fits. We noticed that, in general the fits with comptt+pegpw are better, so we interpreted our results here, taking this model into account.
3. Results
Table 1 summarizes key results of our data analysis. In Fig. 1 a time history of the two fluxes (thermal and powerlaw) is shown for our database. Only on one occasion (MJD =53 633.054) was the powerlaw component not necessary to achieve a good fit. This absence of the powerlaw component (only 1 out of 14 observations) for Sco X-1 represents a variability to a lesser degree than observed with RXTE/HEXTE (High Energy X-ray Timing Experiment) long-term observations (D’Amico et al. 2001a,c). It is unclear what causes the powerlaw component to disappear.
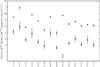 |
Fig. 1 INTEGRAL/ISGRI thermal (20–50 keV: circles) and powerlaw (20–200 keV: squares) fluxes for Sco X-1 plotted against MJD − 50 000 (as derived from OSA software). Data span of 7 years of observations (from 2003 to 2010). The arrow is a 3σ upper limit of ~5 × 10-12 in the 50 to 200 keV flux. |
Observations from the year 2000 up to now of Sco X-1 are shown in Table 2. It can be seen that our database presented here is the longest one for Sco using INTEGRAL/IBIS, besides the fourth INTEGRAL catalog itself.
Modern observations of Sco X-1.
From the results shown in Table 1, the average
fluxes are  erg cm-2 s-1 and
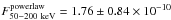 erg cm-2 s-1. Using
the 2.8 kpc distance to Sco X-1 (Fomalont et al.
2001), we have Lthermal = 4.6 ± 0.8 × 1036 erg
s-1 and Lpowerlaw = 1.6 ± 0.8 × 1035 erg
s-1. For comparison, the thermal flux given by D’Amico et al. (2001c) was
erg cm-2 s-1. Using
the 2.8 kpc distance to Sco X-1 (Fomalont et al.
2001), we have Lthermal = 4.6 ± 0.8 × 1036 erg
s-1 and Lpowerlaw = 1.6 ± 0.8 × 1035 erg
s-1. For comparison, the thermal flux given by D’Amico et al. (2001c) was 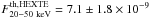 erg cm-2 s-1
characterizing a high degree of variability in the thermal component.
erg cm-2 s-1
characterizing a high degree of variability in the thermal component.
 |
Fig. 2 Powerlaw (solid lines) and comptt (dashed lines) 50–200 keV components plotted against the thermal component (20–50 keV) using the results displayed in Table 1. As in Fig. 1, the arrow denotes a 3σ upper limit of ~5 × 10-12 erg cm-2 s-1 to the powerlaw flux. |
In Table 1 we also list the fluxes in the 50–200 keV derived from the comptt+comptt model. For our database the average plasma temperature of the second comptt was found to be 60.4 ± 1.1, as would be expected to extend the fit up to ~200 keV (Farinelli et al. 2008). It is also important to highlight that the temperature of the seed (Wien) photons for this (second) comptonization are on the order of 1 keV, again as we would expect.
Although, variability can be noticed from the results displayed in Table 2, it is noteworthy that, taking only INTEGRAL observations into account (Cols. 4–8 in the Table 2), the degree of variability is not extreme (exception to this is the total 20–40 keV flux). When compared to RXTE/HEXTE results (Cols. 2, 3), this is no longer valid. Our observations do not confirm the steep spectra measured by HEXTE in some occasions. Also, our fluxes are much lower than the ones reported by HEXTE.
Thanks to our long-term INTEGRAL/IBIS database on Sco X-1, we were able to track the behavior of its hard X-ray emission (E > 50 keV). As shown in Fig. 2 the hard X-ray emission from 50 to 200 keV has a tight correlation with the emission between 20 and 50 keV. Up to this energy, the spectral modeling of our data (as well of Di Salvo et al. 2006) is the comptonization of seed photons of lower energies by a hot plasma. Due to the compelling correlation of Fig. 2 we thus suggest that the physical mechanism responsible for the emission up to 200 keV in Sco X-1 is comptonization.
4. Discussion
The INTEGRAL observations of Sco X-1 reported here show that a nonthermal hard component is almost always needed to fit the Sco X-1 X-ray spectra, contradicting earlier results based on HEXTE/RXTE data.
The most important result of this work is the tight correlation between the thermal and nonthermal fluxes found in the IBIS data. This seems to indicate that the same mechanism responsible for the thermal component is also at work in the case of the nonthermal powerlaw component. We, thus, interpret the high-energy component as a second comptonization. As we have shown here (see Fig. 2, this second component can be fitted by the comptonization of seed photons by a ~60 keV plasma (a second comptt). In this scenario the spectra up to 50 keV can be interpreted as comptonization of seed photons coming from the neutron star itself, by a ~2.71 ± 0.04 keV plasma (cloud), as derived from the values shown in Table 1. As we have highlighted, a pure blackbody model also provides an adequate fit to our Sco X-1 spectra up to 50 keV. The second comptonization component (50 to 200 keV) must be interpreted as originating in an outer part of the system, requiring (as expected) an (electron) temperature on the order of 60 keV. But, as we have shown here, the tight correlation between the fluxes of the two components is also held with the 50 to 200 keV spectra modeled as a simple powerlaw (see Fig. 2). Based on this correlation, it is our suggestion that the flux of Sco X-1 up to 200 keV is due to comptonization. Beacause the fits from 50 to 200 keV with a powerlaw model are slightly better (as we have shown, see Table 1), we are also suggesting that the comptonization in this part of the spectrum is nonthermal in origin.
Figure 3 shows a simultaneous RXTE and INTEGRAL
observation. The data from 5 to 50 keV is well fitted by a single comptt
component with a temperature of  . This strengthens our interpretation for the
Comptonization origin of the soft Sco X-1 spectra. As already mentioned, the average plasma
temperature derived from the results of Table 1 is
2.71 ± 0.04 keV, which is in very reasonable agreement with the joint fit.
. This strengthens our interpretation for the
Comptonization origin of the soft Sco X-1 spectra. As already mentioned, the average plasma
temperature derived from the results of Table 1 is
2.71 ± 0.04 keV, which is in very reasonable agreement with the joint fit.
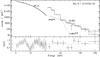 |
Fig. 3 Joint PCA/RXTE and IBIS/INTEGRAL observation of Sco X-1. The spectrum was fitted by a
model with a normalization constant (between PCA and IBIS), photoelectric absorption,
plus a comptt and powerlaw components. Because the PCA cannot constrain the equivalent
hydrogen column for the absorption, its value was fixed at a value of 4. The plasma
temperature (derived from comptt model) is |
In our database, the average powerlaw index is 3.06 ± 0.21, in agreement with values for LMXBs (e.g., Di Salvo et al. 2006). This result differs, however, from the reported values derived from long-term HEXTE/RXTE observations (D’Amico et al. 2001c). It is not clear what causes this discrepancy, but it may be the long-term intrinsic variability of the source.
Our thermal luminosities are within 2.8–6.5 × 1036 erg s-1. It has been claimed before (D’Amico et al. 2001b) that the appearance of the powerlaw component in Z sources is tied to a thermal luminosity greater than 4 × 1036 erg s-1. Our results here, as well as others (e.g., Di Salvo et al. 2006), contradict this statement.
5. Conclusions
We shown evidence here of comptonization up to 200 keV in Sco X-1 spectra, which is supported by a strong correlation between the fluxes from 20 to 50 keV and 50 to 200 keV. This (second) comptonization might be nonthermal in origin. We analyzed a seven-year database of IBIS/INTEGRAL data, which turned out to be the longest IBIS database on Sco X-1 (besides the 4th source catalog). We found no evidence of any preferred luminosity state for the thermal
component regarding the appearance of the hard X-ray tail. Our powerlaw indexes are fully compatible with the reported values for LMXBs. We found no evidence of any states with Γ ~ 0 reported before in the literature. By analyzing a simultaneous PCA/RXTE and IBIS/INTEGRAL observation of Sco X-1, we were able to fit the thermal part of the spectrum from 5 to 50 keV with a single Comptonization model. The production of hard X-ray tails in Z sources is still a hot topic of debate, and the power and unique capabilities of IBIS/INTEGRAL is a fundamental tool for better constraining physical models of their origins.
Acknowledgments
T.M. gratefully acknowledges CAPES-Brazil for financial support. We thank an anonymous referee for comments that helped us in improving the quality of our study.
References
- Bird, A. J., Bazzano, A., Bassani, L., et al. 2010, ApJS, 186, 1 [NASA ADS] [CrossRef] [Google Scholar]
- D’Amico, F., Heindl, W. A., Rothschild, R. E., & Gruber, D. E. 2001a, ApJ, 547, L147 [NASA ADS] [CrossRef] [Google Scholar]
- D’Amico, F., Heindl, W. A., Rothschild, R. E., & Gruber, D. E. 2001b, in Gamma 2001: Gamma-Ray Astrophysics, eds. S. Ritz, N. Gehrels, & C. R. Shrader, AIP, Conf. Ser., 587, 44 [Google Scholar]
- D’Amico, F., Heindl, W. A., Rothschild, R. E., et al. 2001c, Adv. Space Res., 28, 389 [NASA ADS] [CrossRef] [Google Scholar]
- Di Salvo, T., Stella, L., Robba, N. R., et al. 2000, ApJ, 544, L119 [NASA ADS] [CrossRef] [Google Scholar]
- Di Salvo, T., Robba, N. R., Iaria, R., et al. 2001, ApJ, 554, 49 [NASA ADS] [CrossRef] [Google Scholar]
- Di Salvo, T., Goldoni, P., Stella, L., et al. 2006, ApJ, 649, L91 [NASA ADS] [CrossRef] [Google Scholar]
- Farinelli, R., Titarchuk, L., Paizis, A., & Frontera, F. 2008, ApJ, 680, 602 [NASA ADS] [CrossRef] [Google Scholar]
- Fomalont, E. B., Geldzahler, B. J., & Bradshaw, C. F. 2001, ApJ, 558, 283 [NASA ADS] [CrossRef] [Google Scholar]
- Giacconi, R., Gursky, H., Paolini, F. R., & Rossi, B. B. 1962, Phys. Rev. Lett., 9, 439 [NASA ADS] [CrossRef] [Google Scholar]
- Goldwurm, A., David, P., Foschini, L., et al. 2003, A&A, 411, L223 [NASA ADS] [CrossRef] [EDP Sciences] [Google Scholar]
- Iaria, R., Di Salvo, T., Robba, N. R., et al. 2004, ApJ, 600, 358 [NASA ADS] [CrossRef] [Google Scholar]
- Lavagetto, G., Iaria, R., di Salvo, T., et al. 2004, Nucl. Phys. B Proc. Suppl., 132, 616 [NASA ADS] [CrossRef] [Google Scholar]
- Lund, N., Budtz-Jørgensen, C., Westergaard, N. J., et al. 2003, A&A, 411, L231 [NASA ADS] [CrossRef] [EDP Sciences] [Google Scholar]
- Paizis, A., Beckmann, V., Courvoisier, T. J.-L., et al. 2003, A&A, 411, L363 [NASA ADS] [CrossRef] [EDP Sciences] [Google Scholar]
- Paizis, A., Farinelli, R., Titarchuk, L., et al. 2006, A&A, 459, 187 [NASA ADS] [CrossRef] [EDP Sciences] [Google Scholar]
- Titarchuk, L. 1994, ApJ, 434, 570 [NASA ADS] [CrossRef] [Google Scholar]
- Ubertini, P., Lebrun, F., Di Cocco, G., et al. 2003, A&A, 411, L131 [NASA ADS] [CrossRef] [EDP Sciences] [Google Scholar]
- van der Klis, M. 2006, Rapid X-ray Variability, eds. W. H. G. Lewin, & M. van der Klis, 39 [Google Scholar]
- van der Klis, M., Swank, J. H., Zhang, W., et al. 1996, ApJ, 469, L1 [NASA ADS] [CrossRef] [Google Scholar]
- Winkler, C., Courvoisier, T. J.-L., Di Cocco, G., et al. 2003, A&A, 411, L1 [NASA ADS] [CrossRef] [EDP Sciences] [Google Scholar]
All Tables
All Figures
|
Fig. 1 INTEGRAL/ISGRI thermal (20–50 keV: circles) and powerlaw (20–200 keV: squares) fluxes for Sco X-1 plotted against MJD − 50 000 (as derived from OSA software). Data span of 7 years of observations (from 2003 to 2010). The arrow is a 3σ upper limit of ~5 × 10-12 in the 50 to 200 keV flux. |
| In the text | |
|
Fig. 2 Powerlaw (solid lines) and comptt (dashed lines) 50–200 keV components plotted against the thermal component (20–50 keV) using the results displayed in Table 1. As in Fig. 1, the arrow denotes a 3σ upper limit of ~5 × 10-12 erg cm-2 s-1 to the powerlaw flux. |
| In the text | |
|
Fig. 3 Joint PCA/RXTE and IBIS/INTEGRAL observation of Sco X-1. The spectrum was fitted by a
model with a normalization constant (between PCA and IBIS), photoelectric absorption,
plus a comptt and powerlaw components. Because the PCA cannot constrain the equivalent
hydrogen column for the absorption, its value was fixed at a value of 4. The plasma
temperature (derived from comptt model) is |
| In the text | |
Current usage metrics show cumulative count of Article Views (full-text article views including HTML views, PDF and ePub downloads, according to the available data) and Abstracts Views on Vision4Press platform.
Data correspond to usage on the plateform after 2015. The current usage metrics is available 48-96 hours after online publication and is updated daily on week days.
Initial download of the metrics may take a while.