Fig. 1
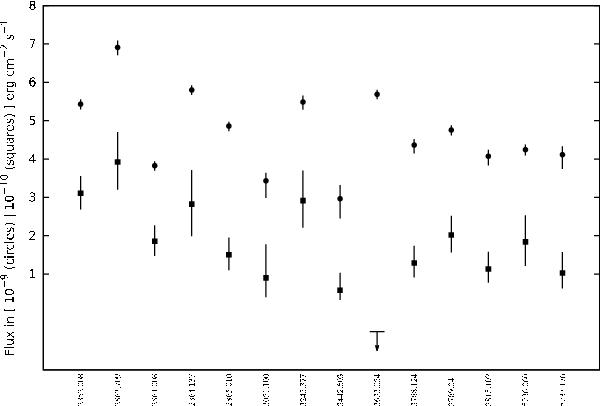
INTEGRAL/ISGRI thermal (20–50 keV: circles) and powerlaw (20–200 keV: squares) fluxes for Sco X-1 plotted against MJD − 50 000 (as derived from OSA software). Data span of 7 years of observations (from 2003 to 2010). The arrow is a 3σ upper limit of ~5 × 10-12 in the 50 to 200 keV flux.
Current usage metrics show cumulative count of Article Views (full-text article views including HTML views, PDF and ePub downloads, according to the available data) and Abstracts Views on Vision4Press platform.
Data correspond to usage on the plateform after 2015. The current usage metrics is available 48-96 hours after online publication and is updated daily on week days.
Initial download of the metrics may take a while.