Fig. 2
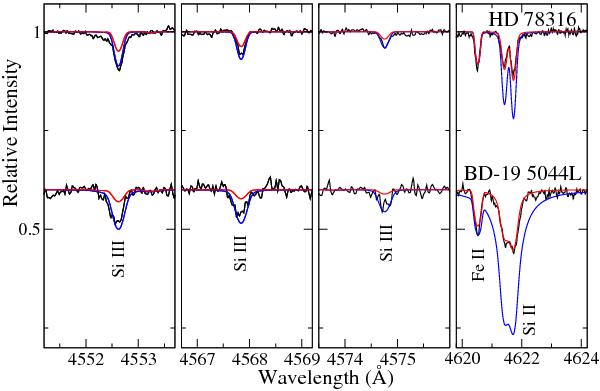
Model fits to lines of Si ii (right) and Si iii (left three panels) to the non-magnetic HgMn Star HD 78 316 (upper spectrum) and the magnetic Bp star BD-19 5044L (lower spectrum). The black lines are the observed spectra, red lines are the best fit model using the abundance derived from Si ii and the blue lines are the best fit model using the abundance derived from Si iii.
Current usage metrics show cumulative count of Article Views (full-text article views including HTML views, PDF and ePub downloads, according to the available data) and Abstracts Views on Vision4Press platform.
Data correspond to usage on the plateform after 2015. The current usage metrics is available 48-96 hours after online publication and is updated daily on week days.
Initial download of the metrics may take a while.