Free Access
Fig. 3
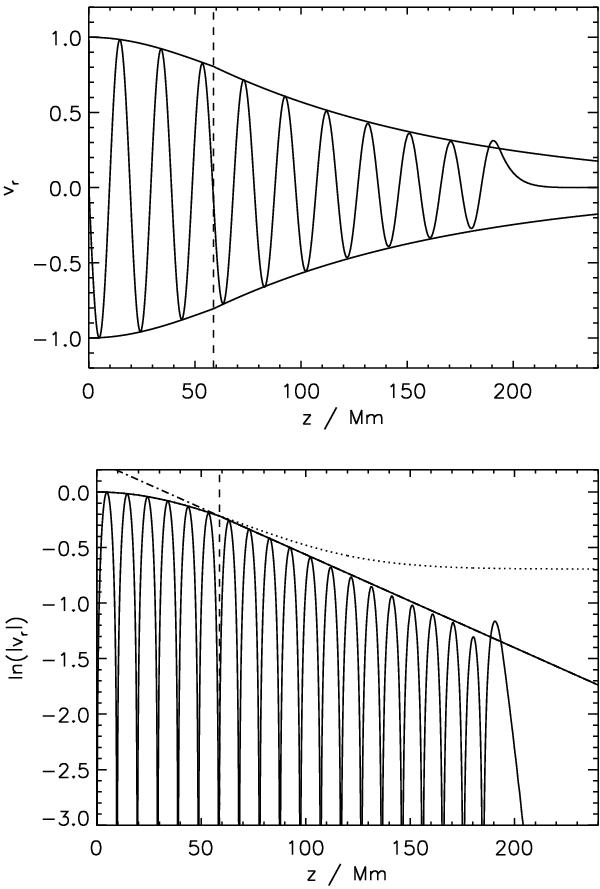
General spatial damping profile for P = 24 s, ϵ = 0.2 and ρ0/ρe = 2. The solid lines show the numerical simulation of the damped kink mode and the analytical damping envelope given by Eq. (6). The dashed vertical line shows the change from Gaussian to exponential damping regimes, located at h = 3λ (see Fig. 2).
This figure is made of several images, please see below:
Current usage metrics show cumulative count of Article Views (full-text article views including HTML views, PDF and ePub downloads, according to the available data) and Abstracts Views on Vision4Press platform.
Data correspond to usage on the plateform after 2015. The current usage metrics is available 48-96 hours after online publication and is updated daily on week days.
Initial download of the metrics may take a while.